Figures & data
Table 1 Sample Grouping Schedule of GBM Tissue and Corresponding Paracancerous Enrolled in This Study
Figure 1 H&E staining result.
Note: The left image is the tissue image at 10 × 10 low power, and the right image is the tissue image at 40 × 10 power of the selected area.
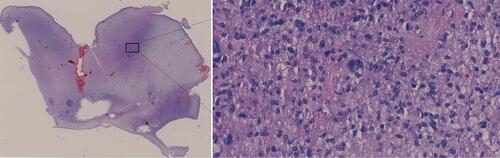
Table 2 Summary of Small RNA (sRNA) Sequencing Datasets
Table 3 List of Differentially Expressed microRNAs (DE miRNAs) in Response to GBM
Table 4 Summary of mRNA Sequencing Datasets
Figure 2 Heatmap of Pearson correlations of the miRNA expression levels among samples.
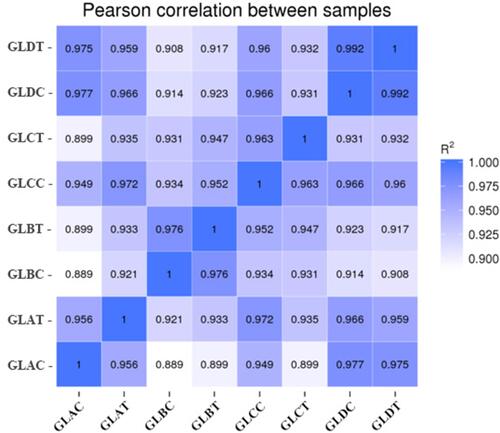
Figure 3 Enriched KEGG pathway scatterplot.
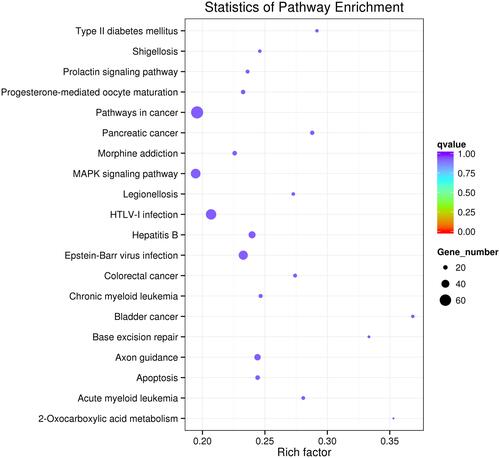
Figure 4 miRNA-mRNA correlation network. The circles in the network indicate the target mRNAs. The orange squares and blue ellipse in the network indicate the DE miRNAs and mRNAs.
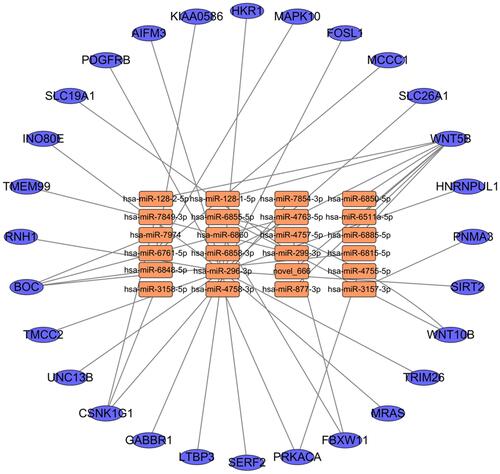
Figure 5 Cell pattern after puromycin screening.
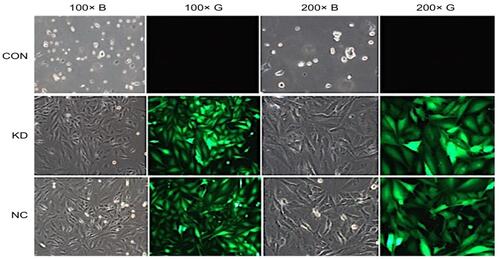
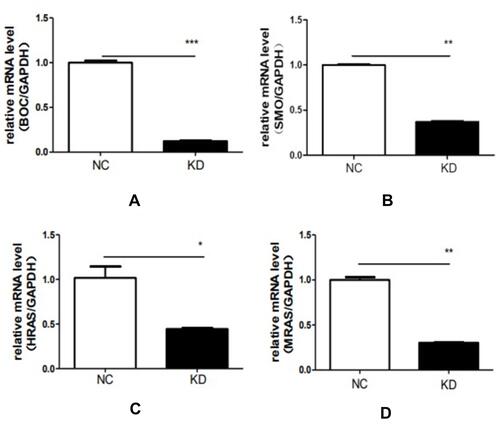
Figure 6 Verification of qRT-PCR results.
Notes: BOC (A); SMO (B); HRAS (C); MRAS (D). *P < 0.05, **P < 0.01, ***P < 0.001.