Figures & data
Figure 1 Expression of DLEU2 in cancer tissues and matched normal tissues in various cancers. (A) DLEU2 expression in cancer tissues and matched normal tissues in various cancers derived from the Oncomine database. (B) DLEU2 expression in different cancers derived from the TIMER website platform and the text in the red box refers to the expression level of DLEU2 in KIRC and LIHC. (C) Differences in DLEU2 expression between KIRC samples and matched normal samples. (D–F) The expression level of DLEU2 correlated significantly with the T stage (D), N stage (E) and M stage (F) in the international TNM staging system of KIRC. (G) Differences in DLEU2 expression between LIHC samples and matched normal samples. (H–J) Expression of DLEU2 correlated significantly with the T stage in the international TNM staging system of LIHC (H), histological grade (I) and AFP level (J). *p<0.05; **p<0.01; ***p<0.001.
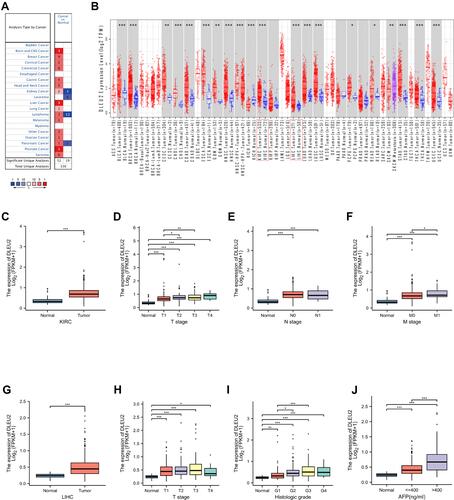
Figure 2 ROC curve of DLEU2 expression predicting the outcome of KIRC (A) and LIHC (B).
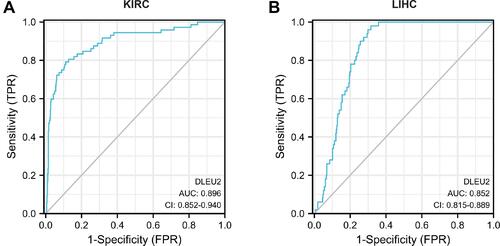
Table 1 Univariate and Multivariate Cox Regression Analysis of KIRC in TCGA
Table 2 Univariate and Multivariate Cox Regression Analysis of LIHC in TCGA
Figure 3 DLEU2-based nomogram and calibration curve. (A) Nomogram of the 1-, 2-, and 3-year survival probabilities of OS in KIRC based on age, the T stage, M stage, histologic grade and DLEU2 expression level; (B) 1-year calibration curve in KIRC; (C) 2-year calibration curve in KIRC; (D) 3-year calibration curve in KIRC; (E) Nomogram of the 1-, 2-, and 3-year survival probabilities of OS in LIHC based on the histologic grade, tumour status and DLEU2 expression level; (F) 1-year calibration curve in LIHC; (G) 2-year calibration curve in LIHC; (H) 3-year calibration curve in LIHC.
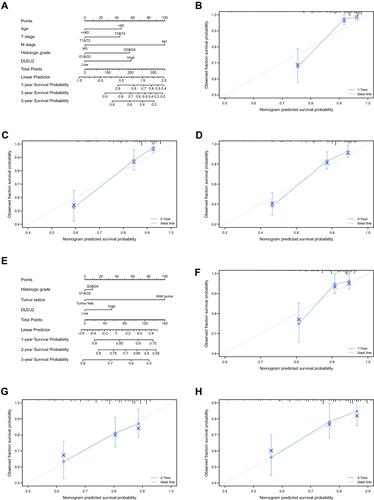
Figure 4 Survival curves of high and low DLEU2 expression in different cancers derived from the Kaplan–Meier Plotter database. Among them, red text refers to DLEU2 high expression group, black refers to DLEU2 low expression group. (A) High expression of DLEU2 indicates a poor OS of KIRC. (B) High expression of DLEU2 is associated with a poor OS in LIHC. (C) High expression of DLEU2 correlates with a poor OS in UCEC. (D) High expression of DLEU2 implies a poor OS in KIRP.
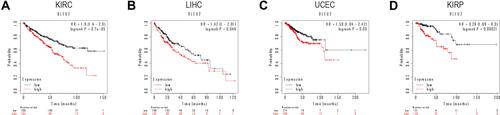
Figure 5 Forest plot of the prognostic value of DLEU2 expression in different cancer types. In the forest plot, the text in the red box refers to the two cancers in this study, KIRC and LIHC, the red dot refers to the value of HR, and the green line represents the 95% CI. (A–C) Prognostic HR of DLEU2 in various cancers for OS (A), DSS (B), and PFI (C).
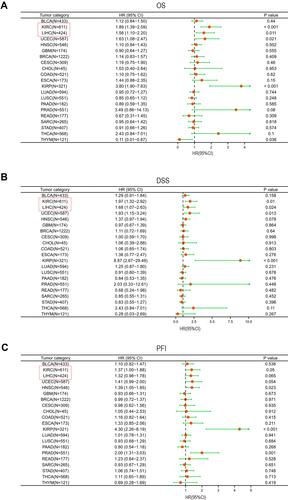
Figure 6 Correlation analyses between the DLEU2 expression level and the infiltrating immune cell level in KIRC (A) and LIHC (B). The red text “cor” and “p” refer to the correlation coefficient and statistical difference between DLEU2 and the level of immune cell infiltration respectively.
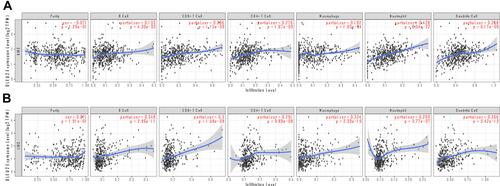
Table 3 Correlation Analysis of DLEU2 Expression with Molecular Markers of Immune Cells
Figure 7 Kaplan–Meier survival curves of high and low DLEU2 expression based on the enrichment of different immune cells. Among them, red text refers to DLEU2 high expression group, black refers to DLEU2 low expression group. (A–H) High DLEU2 expression indicates a worse prognosis based on the enrichment of B cells (A), CD4+ memory T cells (B), CD8+ T cells (C), macrophages (D), NK T cells (E), Treg T cells (F), and Th1 cells (G) in KIRC. (I–P) High DLEU2 expression is associated with a poor prognosis based on the enrichment of various immune cells, such as B cells (I), CD4+ memory T cells (J), CD8+ T cells (K), macrophages (L), NK T cells (M), Treg T cells (N), Th1 cells (O) and Th2 cells (P).
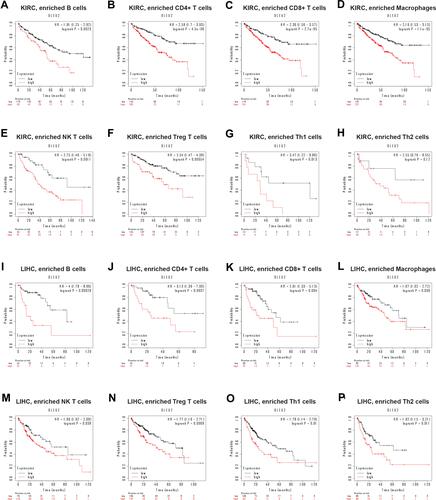
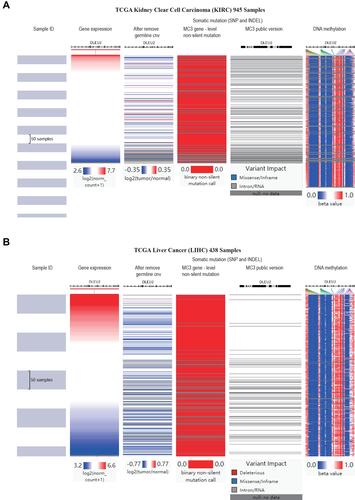
Figure 8 Analysis of gene expression, CNVs, somatic mutations and methylation in KIRC and LIHC. Heat map displaying the correlations between DLEU2 expression and CNVs, somatic mutations, and methylation in KIRC (A) and LIHC (B).