Figures & data
Figure 1 Flowchart of the selection of the studies in the meta-analysis.
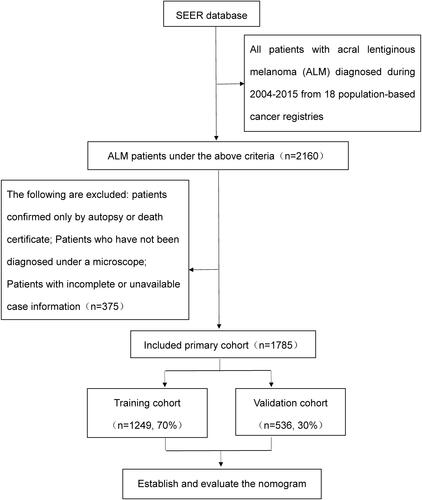
Table 1 Baseline Characteristics of Patients with ALM
Table 2 Variables Selected by Multivariate Cox Regression Analysis (Training Cohort)
Figure 2 Nomogram of ALM.
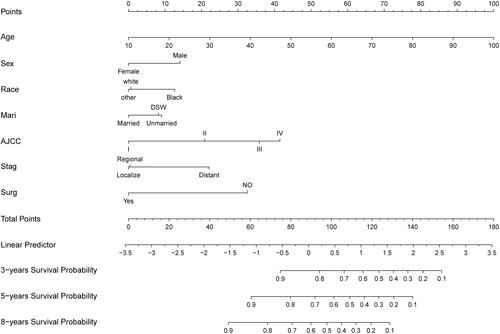
Figure 3 Receiver operating characteristic curves. (A and B) represent the training cohort and validation cohort of the nomogram, while (C and D) represent the training cohort and validation cohort of the AJCC staging system, respectively.
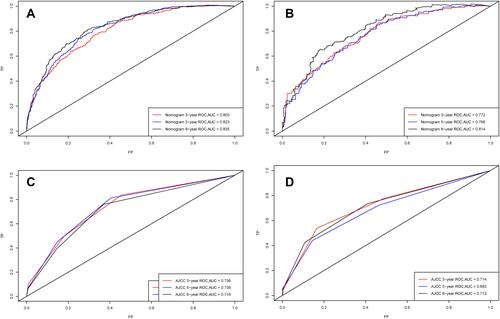
Figure 4 Calibration diagram. (A, C, and E) represent the standard curves of 3-, 5-, and 8-year OS in the training cohort, while (B, D, and F) represent the standard curves of 3-, 5-, and 8-year OS in the validation cohort, respectively.
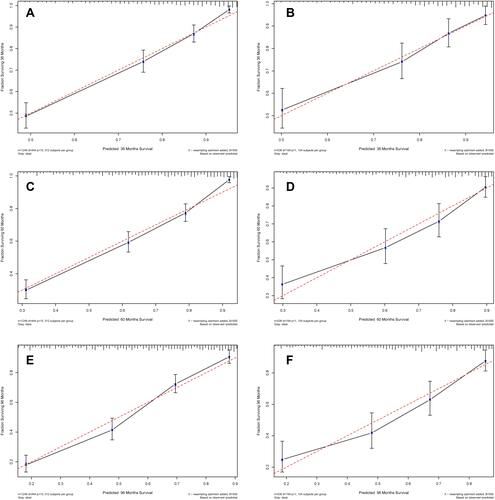
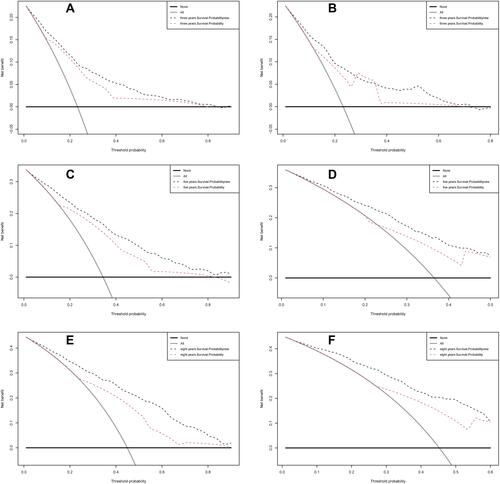
Figure 5 DCA. (A, C, and E) represent the DCA of 3-, 5-, and 8-year OS in the training cohort, while (B, D, and F) represent the DCA of 3-, 5-, and 8-year OS in the validation cohort, respectively.