Figures & data
Table 1 The TEAD Family Primer Sequences Used in RT-PCR
Figure 1 The expression of TEAD family in OSC. (A–C) The mRNA expression of TEAD family in OSC obtained from GEPIA, GE-mini and Oncomine databases. T and N represent the OSC tissues and normal tissues, respectively. (D) mRNA expression levels of different TEAD family members in normal ovary cell line IOSE80 and OSC cell lines A2780 and TOV112D experimented by RT-PCR. (E) The mRNA expression level of TEAD family members in the clinical samples. OSC represents ovarian serous carcinoma.
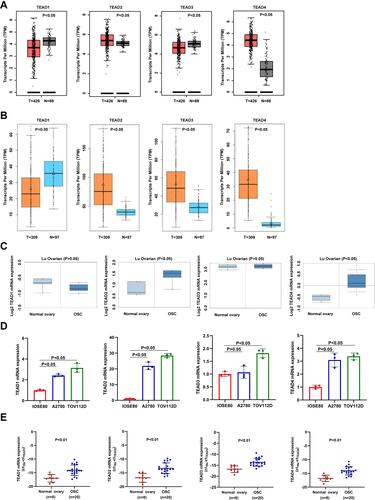
Figure 2 Analysis of TEAD family expression on the prognosis of OSC patients. (A–C) The relationship between TEAD family and OS, PFS and PPS in OSC patients described by Kaplan–Meier plotter, respectively.
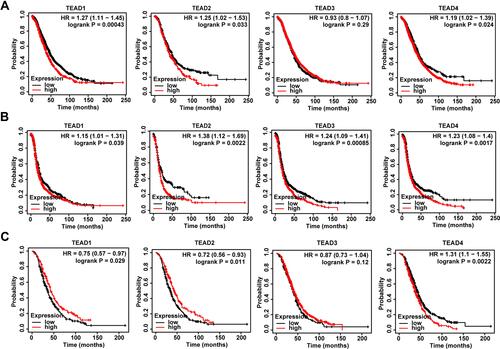
Figure 3 Evaluation of diagnostic value of TEAD family in OSC. (A–D) ROC curve analysis of TEAD family members for the diagnostic values of OSC patients.
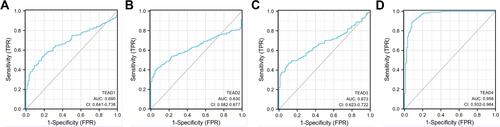
Figure 4 Genetic alteration and functional enrichment analysis of TEAD Family in OSC patients. (A) Description of the mutation rates in each TEAD family member in OSC patients. (B) The PPI network of TEAD family-associated coexpression genes as completed by STRING and Cytoscape. (C) Bar plot of GO analysis in biological process, cellular component and molecular function. (D) KEGG enrichment analyzed by WebGestalt.
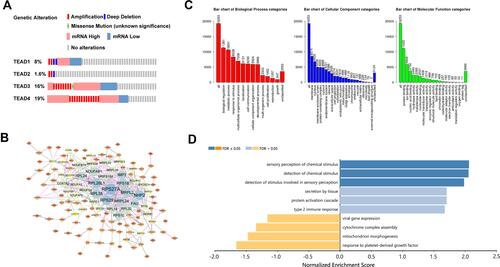
Table 2 The Cox Proportional Hazard Model of the TEAD Family and Six Tumor-Infiltrating Immune Cells in OSC
Figure 5 The associations between differentially expressed TEAD family members and immune cell infiltration. (A–D) The effect of TEAD1/2/3/4 on the immune cell infiltration analyzed by TIMER2.0.
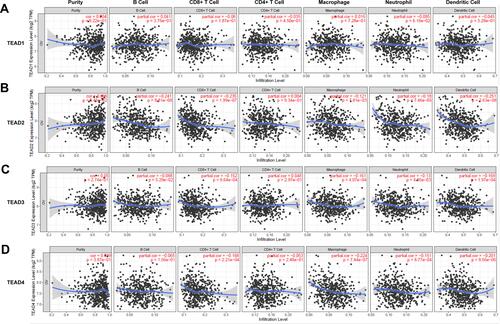
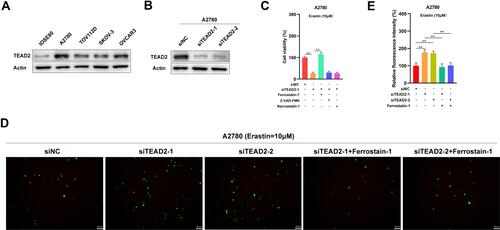
Figure 6 TEAD2 inhibited ferroptosis in A2780 cells. (A) The expression of TEAD2 in normal ovary cell line IOSE80 and OSC cell lines A2780, TOV112D, SKOV-3 and OVCAR3. (B) Knock down of TEAD2 in A2780 cells. (C) Knockout of TEAD2 in A2780 cells facilitated the cell death induced by erastin in A2780 cells. A2780 cells deal with erastin (10 μM) with or without a cell death inhibitor including ferrostatin-1 (5 μM), ZVAD-FMK (10 μM) and necrostatin-1 (5 μM) for 24 h. Cell death was experimented by a CCK-8 kit. Data shown represent mean ± SD (n=3). **p < 0.01. (D and E) TEAD2 could regulate the level of ROS in A2780 cells. A2780 cells deal with erastin (10 μM) for 24h and then the intracellular ROS was tested. Data shown represent mean ± SD (n=3). **p < 0.01.