Figures & data
Figure 1 Comparison of immune cell fraction between normal volunteers and patients with major depression disorder.
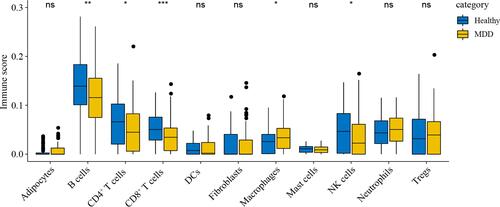
Figure 2 Construction of a WGCNA co-expression network of MDD patients. (A) Sample clustering molecular map; red representation of samples is marked as nonzero in the table. (B) Calculation and selection of the optimal soft threshold power. The influence of different powers on scale Independence (left), and the effect of different powers on mean connectivity (right). (C) Tree diagram of clustering of 20,011 genes and 13 combined modules in 125 MDD patients. (D) Correlation heat map of 13 modules.
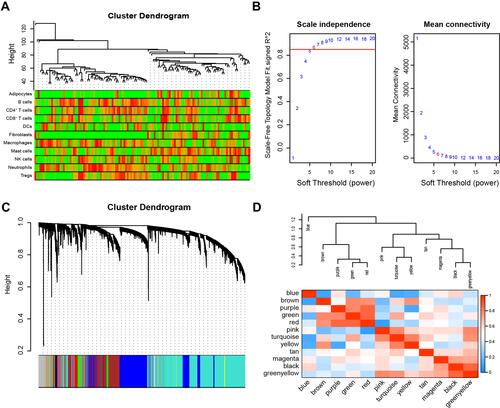
Figure 3 Correlation heatmap of Co-expression module and immunocyte score of MDD patients. Heatmap of the correlation between each module and the blood immune cell scores of MDD patients, red represents positive correlation, blue represents negative correlation. Each unit contains the corresponding correlation coefficient and P-value.
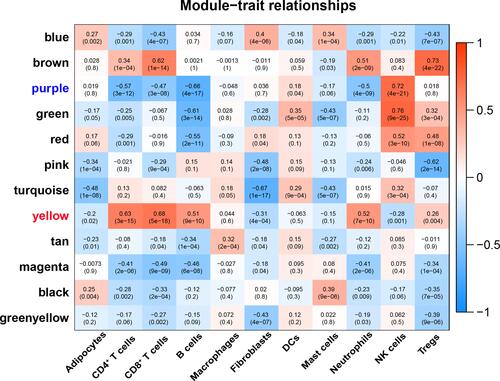
Figure 4 The correlation histogram of genes in the modules and immunocyte scores. There were significant levels of 13 co-expression modules related to B cells, CD4+ T cells, CD8+ T cells, and NK cells.
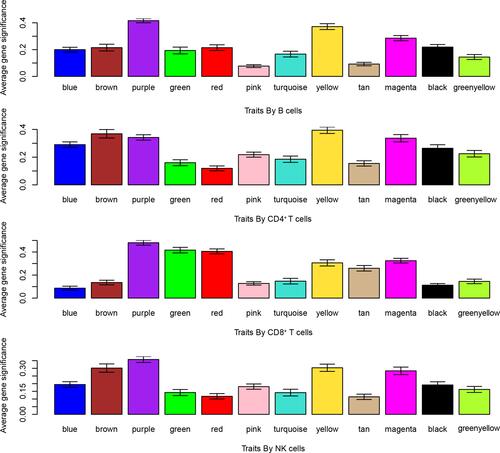
Figure 5 Scatter diagram of the correlation between genes and immunocyte scores. Scatter diagram of the correlation between genes and four immunocyte scores (B cells, CD4+ T cells, CD8+ T cells, NK cells) in the yellow and purple module.
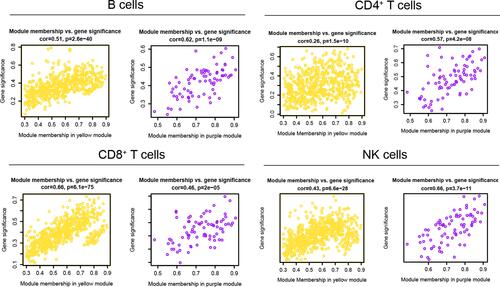
Figure 6 GO and KEGG pathway enrichment for genes in the immune related modules. (A) The top 15 enriched biological processes of genes in the yellow module. (B) The top 5 enriched signaling pathways of genes in the yellow module. (C) The top 15 enriched biological processes of genes in the purple module. (D) The top 5 enriched signaling pathways of genes in the purple module.
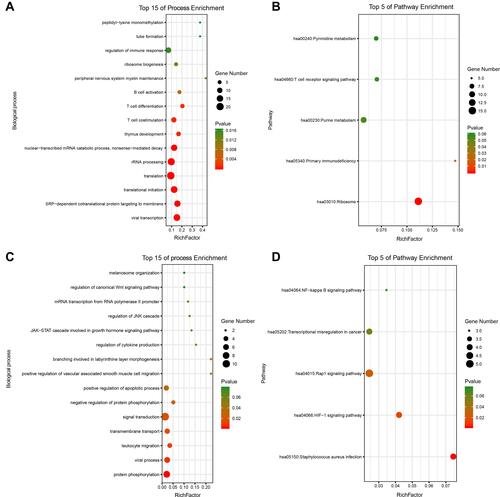
Figure 7 Hub genes in immune related key modules. (A) Gene PPI analysis, visualization, and 10 core genes in the yellow module. (B) Gene PPI analysis, visualization, and 10 core genes in the purple module.
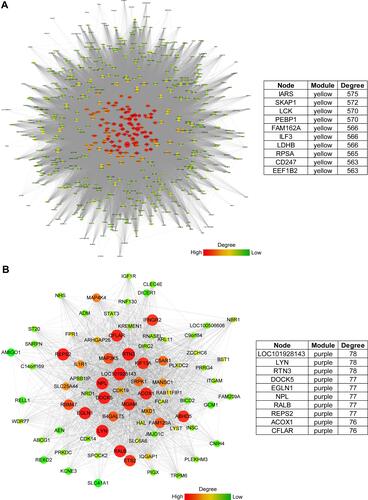
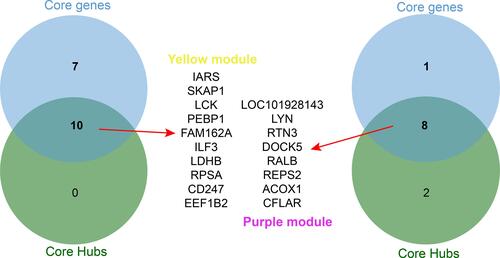
Figure 8 Core genes in immune related key modules. The key genes in the PPI network and the genes whose correlations with modules were higher than 0.85 were analyzed by a Venn diagram and screening of the core genes that were consistent in both. The top is the Venn diagram of the yellow module, and the bottom is the Venn diagram of the purple module.