Figures & data
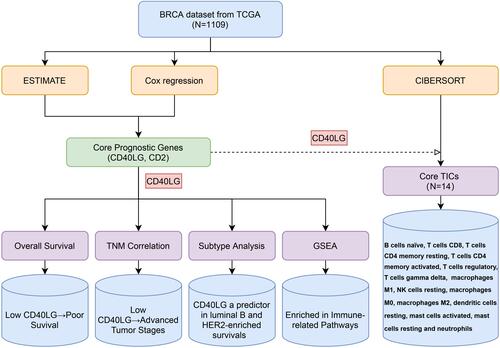
Figure 1 Flow diagram of the study design and main results.
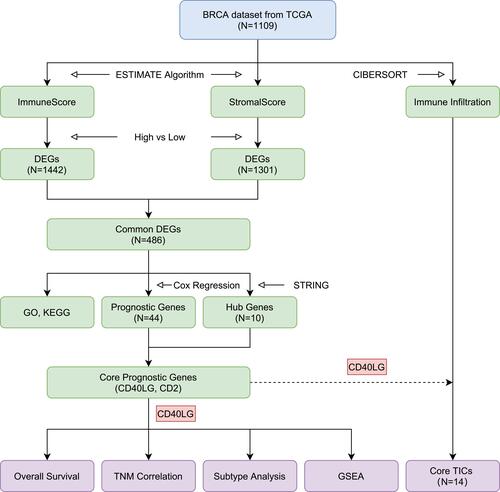
Figure 2 ImmunScore/StromalScore/ESTIMATEScore and overall survival. (A) ImmuneScore and overall survival. (B) StromalScore and overall survival. (C) ESTIMATEScore and overall survival.
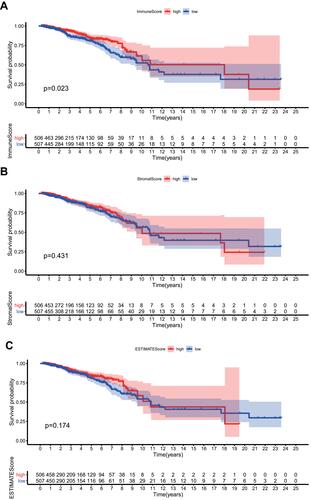
Figure 3 DEGs, GO and KEGG analysis. (A) Heatmap of top 20 upregulated and downregulated DEGs in high and low ImmuneScore groups. (B) Heatmap of top 20 upregulated and downregulated DEGs in high and low StromalScore groups. (C) Venn diagrams of commonly upregulated and downregulated genes. (D) Biological process, cellular component, molecular function and KEGG pathway enrichment analysis.
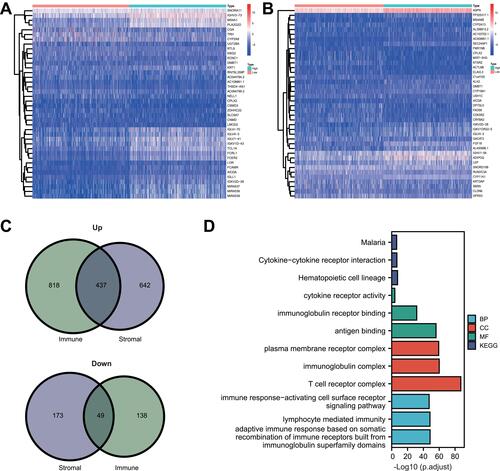
Figure 4 Core prognostic genes analysis. (A) Forest plot of prognostic genes for overall survival using univariate Cox proportional hazard analysis. (B) Genes with the maximum numbers of adjacent nodes in the PPI network. (C) Venn diagram of core prognostic genes.
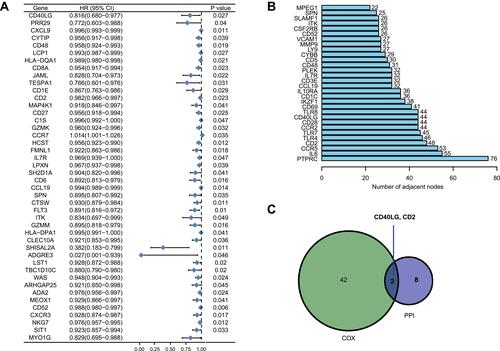
Figure 5 CD40LG expression level and its association with tumor clinicopathological characteristics. (A) Comparison of CD40LG expression between normal samples and tumor samples. (B) Comparison of CD40LG expression between normal samples and paired tumor samples. (C) Kaplan–Meier survival curve of high and low CD40LG expression groups. (D) CD40LG expression and tumor T stage. (E) CD40LG expression and tumor N stage. (F) CD40LG expression and tumor distal metastasis. (G) CD40LG expression and tumor overall TNM stage.
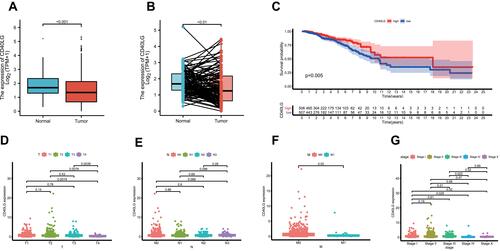
Figure 6 Analysis of PAM50 molecular subtypes and CD40LG. (A) The expression of CD40LG in each molecular subtype. (B) Survival curve of luminal A stratified by CD40LG expression. (C) Survival curves of luminal B stratified by CD40LG expression. (D) Survival curves of HER2-enriched stratified by CD40LG expression. (E) Survival curves of basal-like stratified by CD40LG expression. (F) Survival curves of normal-like stratified by CD40LG expression.
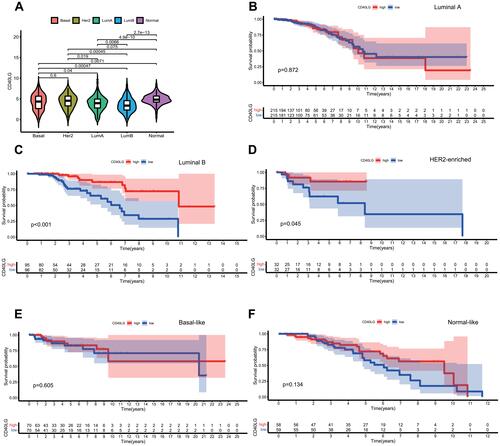
Figure 7 GSEA analysis of CD40LG expression. (A) KEGG pathway enrichment in high CD40LG expression group. (B) KEGG pathway enrichment in low CD40LG expression group.
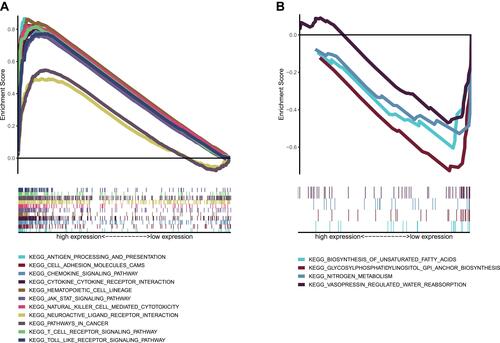
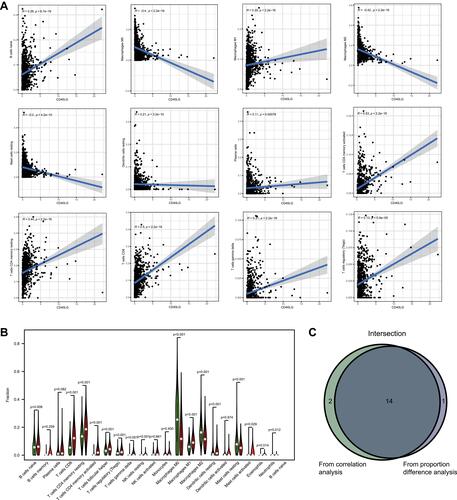
Figure 8 Associations between CD40LG expression and TICs. (A) Correlations between CD40LG expression and TICs. (B) Violin diagram showing proportions of TICs in high and low CD40LG expression groups. (C) Venn diagram of showing intersecting TICs in correlation analysis and difference proportion analysis.