Figures & data
Table 1 Demographics and Clinical Characteristics of the Patients
Figure 1 Flowchart of patient selection. Detailed selection of OG patients in 2000–2018 from SEER database.
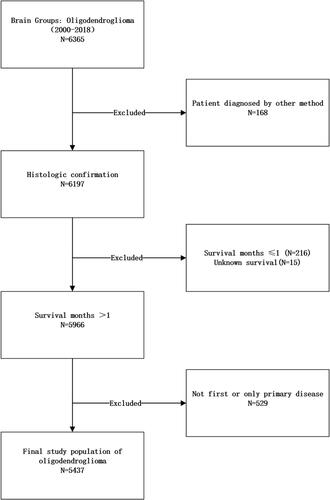
Table 2 Univariate and Multivariate Cox Regression Analysis of Factors Associated with OS in the Training Set (n =5437)
Table 3 Univariate and Multivariate Cox Regression Analysis of Factors Associated with CSS in the Training Set (n =5437)
Figure 2 All-cause mortality and tumor-specific mortality based on age upon diagnosis. The difference between the curves was statistically significant according to the Log rank test (p < 0.001).
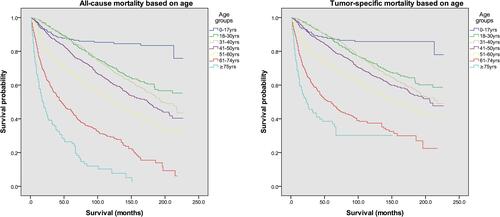
Figure 3 Nomogram for predicting OS and CSS of OG patients. (A) Nomogram for predicting 5-, 10- and 15-year OS of OG patients; (B) Nomogram for predicting 5-, 10- and 15-year CSS of OG patients.
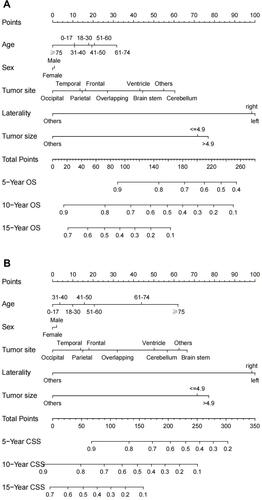
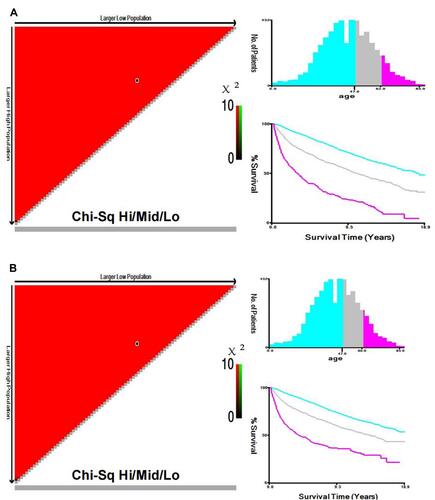
Figure 4 (A) Optimal cut-off point determined using X-tile software for OS; (B) Optimal cut-off point determined using X-tile software for CSS.