
Figures & data
Table 1 Co-Morbidity and Medical Conditions of Children Admitted to Stabilization Center in Dire Dawa, from 2017 to 2020 (n = 665)
Figure 1 Treatment outcomes of SAM children treated in stabilization center, Eastern Ethiopia.
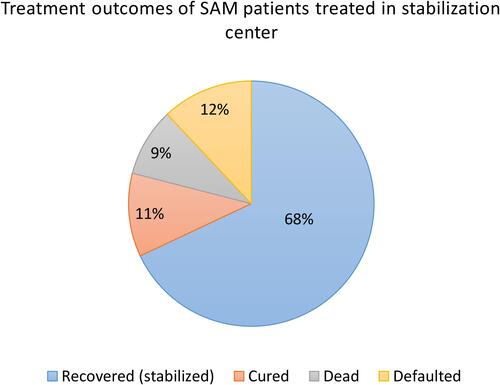
Table 2 Life Table Showing the Survival and Hazards of SAM Children Treated in Stabilization Center, in Dire Dawa from 2017 to 2020, Ethiopia
Figure 2 Hazard (1-survival) curve for admitted SAM children in stabilization center: from admission to outcome (death).
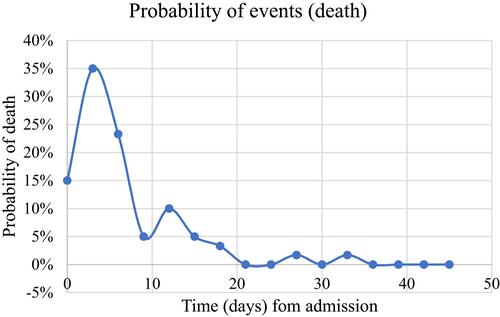
Table 3 Bivariable Cox Proportional Hazard Regression Model for Predictors of Death from SAM in Eastern Ethiopia
Table 4 Multivariable Cox-Proportional Hazard Regression Model for Predictors of Death from SAM