
Figures & data
Table 1 Study Subject's Characteristics
Table 2 Hematologic Profiles Between Non-Severe and Severe COVID-19 Patients
Figure 1 Comparison of hematologic profiles between non-severe and severe COVID-19 patients. (A) Haemoglobin; (B) haematocrit; (C) white blood cells count; (D) platelet count; (E) relative neutrophils (%); (F) relative lymphocytes (%); (G) neutrophil to lymphocyte ratio (NLR); (H) absolute lymphocyte count; (I) C-reactive protein; (J) lactate dehydrogenase; (K) ferritin. ºDenotes outlier values outside the Q1-Q3 range. *Denotes extreme outlier values which is defined as distance to the median >1.5 times the IQR.
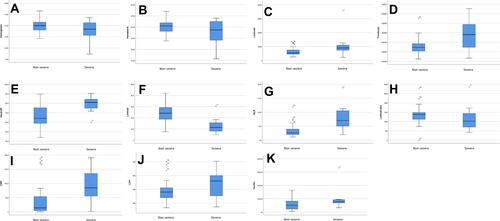
Figure 2 Scatter plot showing correlation between neutrophil to lymphocyte ratio and C-reactive protein.
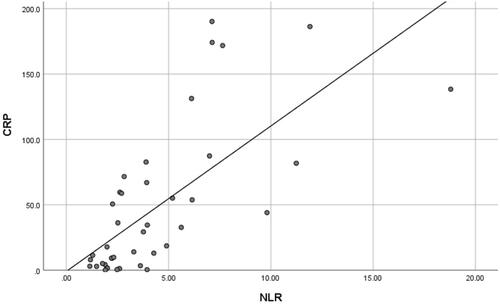
Table 3 Correlation Between NLR, Absolute Lymphocyte Count, CRP, LDH and Ferritin in Hospitalized COVID-19 Patients