
Figures & data
Table 1 Clinical Characteristics of Different LDH Levels
Figure 1 baPWV and CVD10 of different LDH levels. (A) Comparison of baPWV between two groups with different LDH levels. (B) Comparison of CVD10 between two groups with different LDH levels. ***P < 0.001.
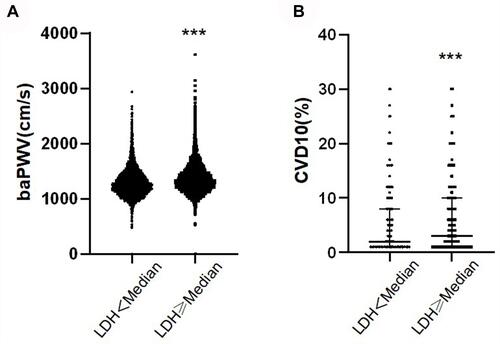
Table 2 Factors Associated with baPWV or CVD10 (Stepwise Multiple Regression Analysis)
Table 3 Clinical Characteristics of the Subjects According to baPWV
Table 4 Clinical Characteristics of the Subjects According to CVD10