
Figures & data
Table 1 Forty-Seven DEGs
Figure 1 Venn diagram analysis of DEGs in different GEO datasets. Individual studies are indicated in different colors. The overlapping parts indicate DEGs common to different GSE datasets. Together, 47 DEGs were screened from four studies.
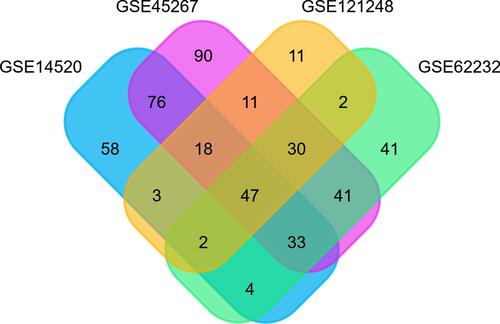
Figure 2 The GO analysis of the 47 identified DEGs performed with the enrichR software. (A) chromosome distribution of DEGs; (B) anatomic distribution of DEGs; (C) down-regulated expression of DEGs in HCC; (D) up-regulated expression of DEGs in HCC.
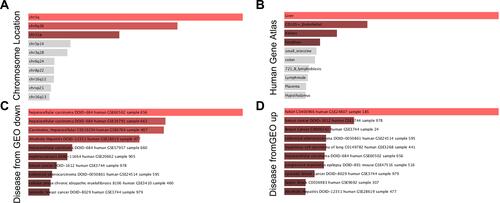
Figure 3 Analysis of PPI network of the 47 identified DEGs using Sting 11.1.
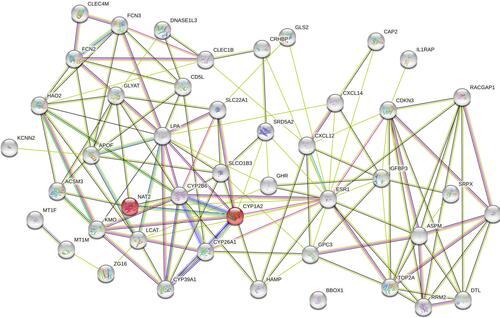
Table 2 Validation of DEGs Correlated to RFS and 5-Year OS with K-M Plotter
Table 3 Clinicopathologic Features and Their Correlation with 5-Year OS and RFS on Univariate Analysis
Figure 4 Forest plots summarizing the analysis of OS and RFS. Multivariate analysis of OS (A) and RFS (B) in HCC patients. The tangle squares on the transverse lines indicate the HR, and the transverse lines represent 95% CI.
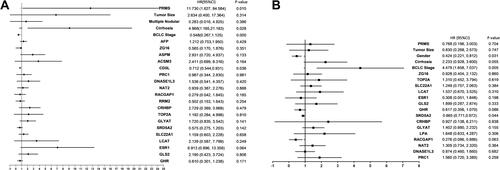
Figure 5 Nomogram to estimate the prognosis with external /internal validation. To use the nomogram, find the position of each variable on the corresponding axis and determine the number of points for each variable. The corresponding points of all the variables are added, and the probabilities of the survival are determined using the lines at the bottom of the nomogram. (A) nomogram for 5-year OS. (B) Internal calibration plot showing the performance of the proposed nomogram in predicting the 5-year OS in the training cohort (n=144). (C) External validation plot showing the predictive performance of the nomogram in estimating the 5-year OS in the validation cohort (n =99). The closer the blue curve is to the red line, the better is the performance. (D) nomogram for 1-year RFS. (E) the internal calibration plot shows the performance of the proposed nomogram in predicting 1-year RFS in the training cohort (n=144). (F) the external validation plot showing the predictive performance of the nomogram in estimating the 1-year RFS in the validation cohort (n=99).
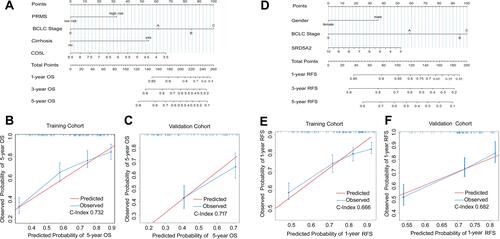
Table 4 Correlation Between CD5L and SRD5A2 Expression and Clinicopathologic Features