Figures & data
Figure 1 CHMP7 expression level. (A) the differential expression of CHMP7 in tumor tissues and adjacent tissues; (B–I) Differential expression of CHMP7 in BLCA, ESCA, PRAD, THCA, UCEC, LUAD, LAML and DLBC in the TCGA merged GTEx dataset; (J–M) Differential expression of CHMP7 protein in BRCA, LUAD, KIRC and UCEC and corresponding normal tissues in the CPTAC dataset(*: P < 0.05; **: P < 0.01; ***: P < 0.001).
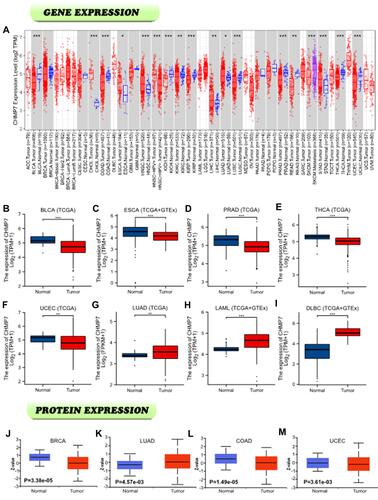
Figure 2 Differential expression of protein levels of CHMP7 in the HPA database. (A) CHMP7 was moderately expressed in normal gastric tissues and lowly expressed in STAD tissues; (B) CHMP7 was moderately expressed in normal kidney tissues and lowly expressed in KIRC tissues; (C) CHMP7 was moderately expressed in normal testicular tissues and lowly expressed in TGCT tissues; (D) CHMP7 was highly expressed in normal colon tissues and lowly expressed in COAD tissues; (E) CHMP7 was moderately expressed in normal lung tissues and lowly expressed in LUAD tissues.
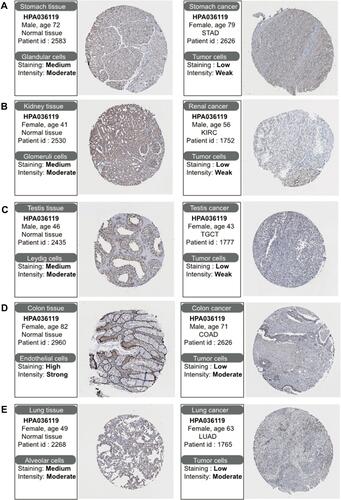
Figure 3 Correlation analysis of CHMP7 expression levels with clinicopathological staging. (A–F): In BLCA, COAD, KIRC, SKCM, THCA and UCS, patients with lower CHMP7 levels showed more advanced tumor staging (*P < 0.05; **P < 0.01; ***P < 0.001).
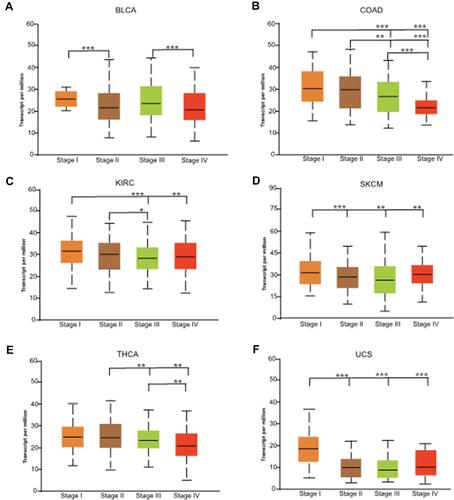
Figure 4 Survival analysis. (A–H) In BRCA (P = 0.018), ESCA (P = 0.037), HNSC (P = 0.031), KIRC (P = 0.004), SARC (P = 0.03), GBM+LGG (P = 0.003) and SKCM (P = 0.03), CHMP7 low expression group had poorer prognosis and shorter OS. In reverse, in LAML (P = 0.029), the prognosis was better in the CHMP7 low expression group; I-N: In BLCA (GSE5287; cox P = 0.008926), BRCA (GSE3143; cox P = 1.3e-03 and GSE7390; cox P = 0.01934), COAD (GSE12945; cox P = 0.035903) and LUAD (jacob-00182-CANDF; cox P=0.026792), low CHMP7 expression was significantly associated with poor prognosis of patients.
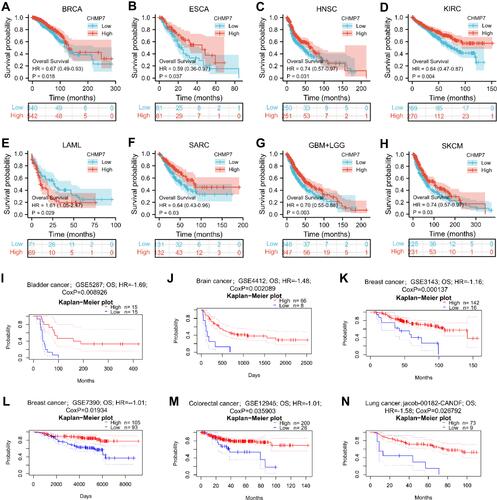
Figure 5 Genetic variation analysis. (A) The main types and frequency of CHMP7 mutation occurrence in each tumor tissue; (B) The main types and loci of CHMP7 mutations; (C) Three-dimensional model of CHMP7 protein; (D) Prognosis of CHMP7 mutations on patients with COAD;(E) Prognosis of CHMP7 mutations on patients with LUSC.
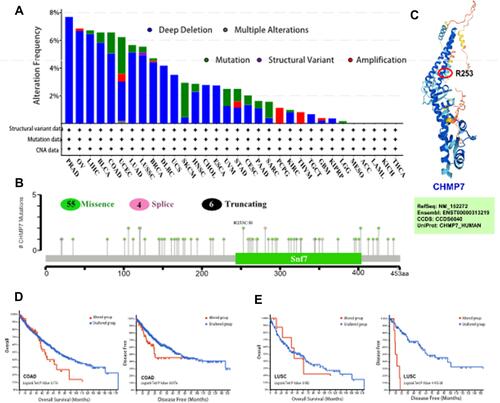
Figure 6 Methylation analysis. (A–J) CHMP7 DNA methylation was significantly negatively correlated with probe cg00140501 in ACC (R = −0.250; P = 0.028), BLCA (R = −0.140; P = 0.003), BRCA (R = −0.170; P < 0.001), COAD (R = −0.200; P = 0.001), LIHC (R = −0.190; P < 0.001), LUAD (R = −0.093; P = 0.048), LUSC (R = −0.180; P < 0.001), PRAD (R = −0.180; P < 0.001), SKCM (R = −0.280; P < 0.001) and STAD (R = −0.230; P < 0.001); (K) The DiseaseMeth database was used to explore the relationship between CHMP7 DNA methylation and different tumor tissues.
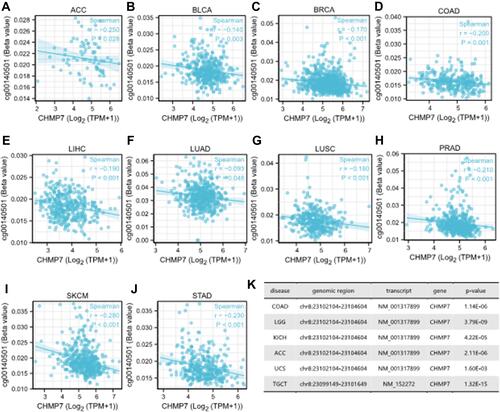
Figure 7 Phosphorylation analysis. (A) Common sites of CHMP7 protein phosphorylation; (B–H) Differential expression of CHMP7 protein in tumor tissues and corresponding normal tissues. IN BRCA and KIRC, tumor tissues were high in phosphorylated proteins; the opposite was true for COAD, LUAD, OV and UCEC.
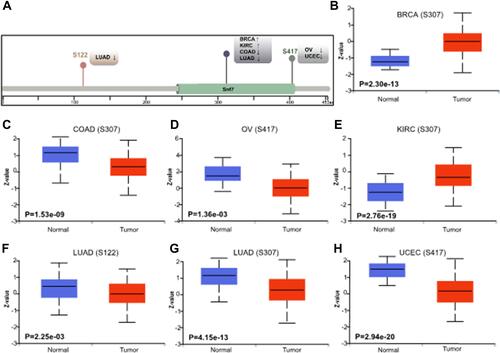
Table 1 The Relationship Between CHMP7 and Different Cell Markers of Immune Cells in COAD and LAML
Figure 8 Heat map of CHMP7 correlation analysis with immune checkpoint molecules and mismatch repair genes in multiple tumor tissues. Darker colors represent more significant differences, red represents positive correlation and blue represents negative correlation.
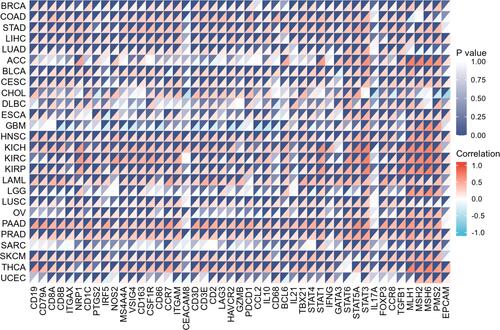
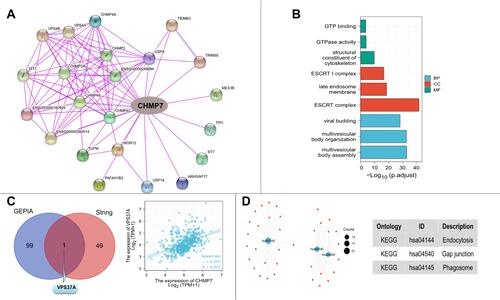
Table 2 Genes Related to CHMP7 Obtained from GEPIA and String
Table 3 Functional Enrichment Analysis of CHMP7 and Its Related Genes
Figure 9 Functional enrichment analysis. (A) PPI network for CHMP7; (B) GO analysis histogram of CHMP7 and its related genes; (C) Venn diagram of genes associated with CHMP7 from GEPIA and String; (D) Scatter plot of KEGG analysis of CHMP7 and its related genes.