
Figures & data
Table 1 Participants’ Demographic Data and Liver Function Tests of NC, HBV, HBV-Treated (HBVT), HCV, and HCV-Treated (HCVT) Groups (n = 250)
Table 2 Coefficient of Determination (R2) Values of Linear Regression Analysis between Demographic Data and Liver Function Tests as Predictor Variables and Blood Glutamine (GLN) or Nitrotyrosine (NT) Levels (ng/mL) as Dependent Variables in HBV, HBV-Treated (HBVT), HCV, and HCV-Treated (HCVT) Groups (n = 250)
Table 3 Levels of Glutamine and Nitrotyrosine (ng/mL) in NC, HBV, HBV-Treated (HBVT), HCV, and HCV-Treated (HCVT) Groups (n = 250)
Table 4 Values of Spearman Correlation Coefficient (Rho), Area Under Receiver Operating Characteristic (AUROC) Curve, Cutoff, Sensitivity (%), Specificity (%), Eigenvalue, and Canonical Correlations between Glutamine (GLN) and Nitrotyrosine (NT) Levels and the HBV DNA Test Positivity in HBV and HBV-Treated (HBVT), and HCV RNA Test Positivity in HCV and and HCV-Treated (HCVT) Groups (n = 250)
Figure 1 The receiver operating characteristic (ROC) curve for glutamine (GLN) and nitrotyrosine (NT) detection of HBV infection according to positive DNA testing in the patient groups: (A) GLU-HBV, (B) NT-HBV, (C) GLU-HBVT, and (D) NT-HBVT.
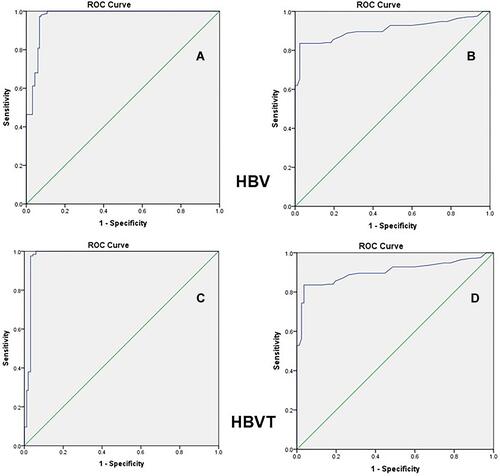
Figure 2 The receiver operating characteristic (ROC) curve for glutamine (GLN) and nitrotyrosine (NT) detection of HCV infection according to positive RNA testing in the patient groups: (A) GLU-HCV, (B) NT-HCV, (C) GLU-HCVT, and (D) NT-HCVT.
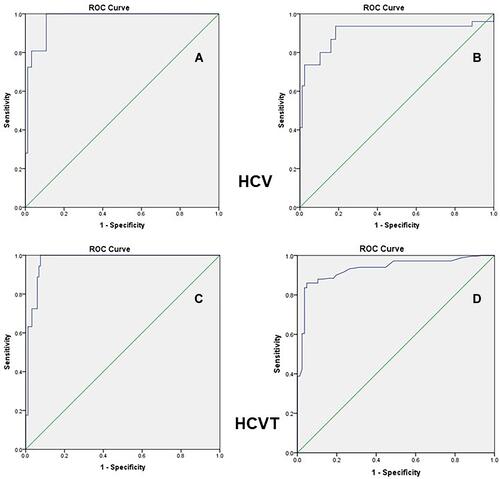
Table 5 Correlation Coefficient (r) Values of Pearson Correlation Analysis between Viral Load (VL, KIU/mL) and GLN or NT Levels (ng/mL) in HBV, HBV-Treated (HBVT), HCV, and HCV-Treated (HCVT) Groups (n = 250)
Table 6 Correlation Coefficient (r) Values of Pearson Correlation Analysis between HBsAg Levels (Log10 IU/mL) and GLN or NT Levels (ng/mL) in HBV and HBV-Treated (HBVT) Groups (n = 250)