Figures & data
Table 1 Primer List for Q-PCR
Figure 1 Venn diagram.
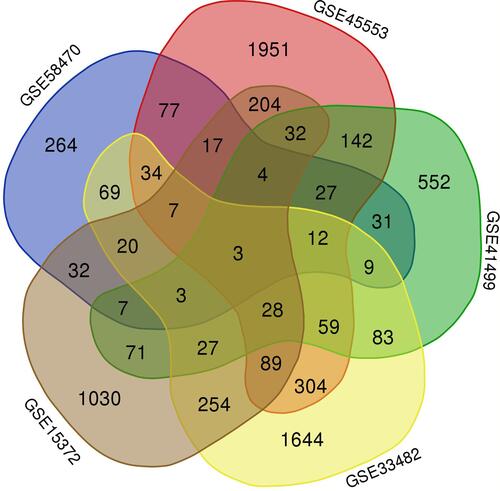
Figure 2 Statistical Analysis of 3 genes in ovarian cancer sensitive and drug-resistant cells from 5 gene chips. (A) The expression level of IFI27 in 5 gene chips; (B) The expression level of JAG1; (C) The expression level of DNM3.
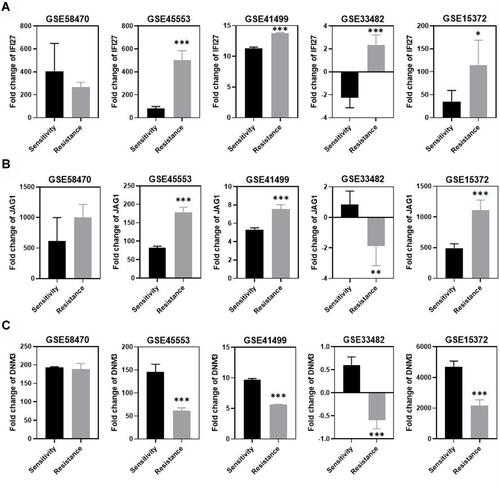
Figure 3 IC50 values of sensitive and cisplatin-resistant cells of ovarian cancer. (A) IC50 in A2780 and A2780-DDP; (B) IC50 in SKOV3 and SKOV3-DDP.
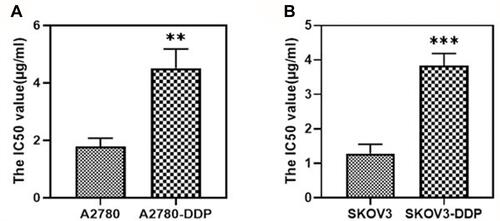
Figure 4 The mRNA expression of each gene in ovarian cancer sensitive and cisplatin-resistant cells by qRT-PCR. (A) mRNA expression of IFI27 in ovarian cancer cells; (B) mRNA expression of JAG1; (C) mRNA expression of DNM3.
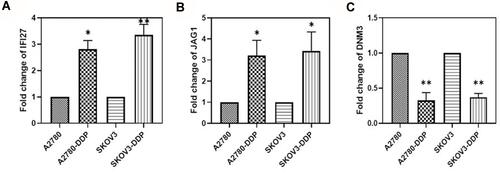
Figure 5 The expression of 3 genes in ovarian cancer chemosensitive and drug-resistant patients from TCGA. (A) mRNA expression of IFI27 in ovarian cancer cells; (B) mRNA expression of JAG1; (C) mRNA expression of DNM3.
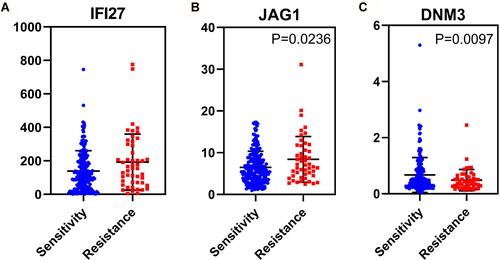
Table 2 IFI27, JAG1 and DNM3 Expression and Clinicopathological Parameters of Ovarian Cancer in TCGA
Figure 6 The relationship between the gene expression and the OS or PFS in platinum-resistant patients with ovarian cancer. (A) The relationship between IFI27 expression and the OS of ovarian cancer platinum-resistant patients; (B) IFI27 and the PFS in platinum-resistance; (C) JAG1 and the OS; (D) JAG1 and the PFS; (E) DNM3 and the OS; (F) DNM3 and the PFS.
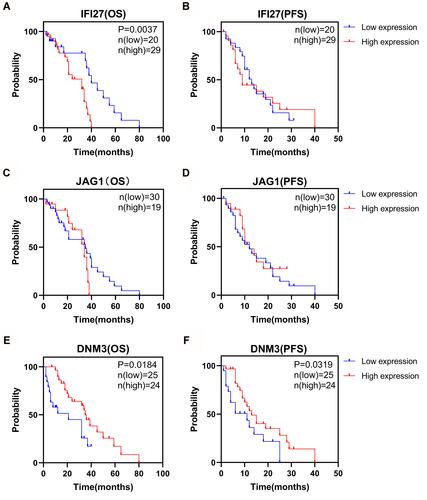
Table 3 Binary Logistics Regression to Evaluate the Factors Influencing Platinum-Resistant Ovarian Cancer Patients
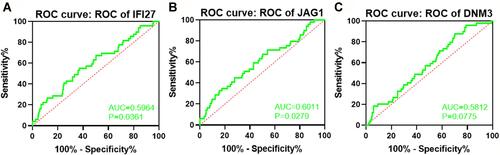
Table 4 The Ability of Genes to Predict Chemotherapy Outcomes in Ovarian Cancer
Figure 7 ROC curves to determine the genes as indicators of ovarian cancer chemosensitivity (A–C).