Figures & data
Table 1 Basic Characteristics of Patients and Survival Analysis According to Different Factors
Table 2 Overall Comparison and Pairwise Comparison of Each Group in Kaplan–Meier Survival Analysis
Table 3 Univariate and Multivariate Cox Proportional Hazards Analysis of Lung Cancer Based on SEER Database
Figure 1 Median survival time. Survival and its growth rate in lung cancer patients from 2000 to 2017. (A and B) According to sex. (C and D) According to primary site. (E and F) According to age. (G and H) According to median household income (inflation adjusted to 2019). (I and J) According to address. (K and L) According to histologic type. (M and N) According to race. (O and P) According to ethnic group.
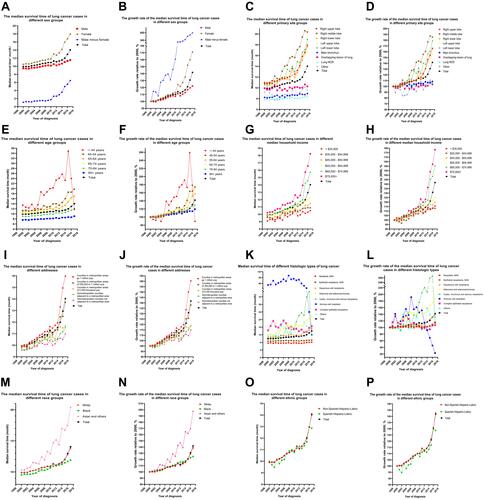
Figure 2 Kaplan–Meier survival curves of lung cancer patients according to primary site and demographics. (A) All primary site groups. (B) Right upper lobe. (C) Right middle lobe. (D) Right lower lobe. (E) Left upper lobe. (F) Left lower lobe. (G) Main bronchus. (H) Overlapping lesion of lung. (I) Right upper lobe and right middle lobe. (J) Right upper lobe and right lower lobe. (K) Right upper lobe and left upper lobe. (L) Right upper lobe and left lower lobe. (M) Middle lobe and right lower lobe. (N) Right middle lobe and left upper lobe. (O) Middle lobe and left lower lobe. (P) Right lower lobe and left upper lobe. (Q) Right lower lobe and left lower lobe. (R) Left upper lobe and left lower lobe. (S) Address groups. (T) Income groups. (U) Ethnic groups. (V) Age groups. (W) Race groups. (X) Sex groups.
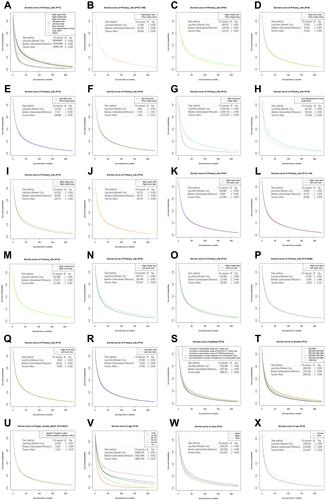
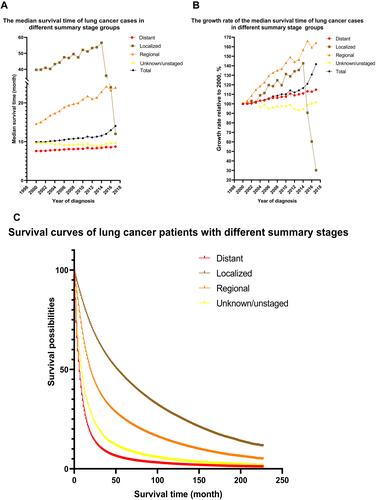
Figure 3 Survival curves of different summary stages and changes in median survival time of lung cancer patients from 2000 to 2017. (A) Median survival time of lung cancer patients at different summary stages from 2000 to 2017. (B) Increase in median survival time of lung cancer patients at different summary stages from 2000 to 2017. (C) Kaplan–Meier survival curves for different summary stages.