Figures & data
Figure 1 The flow chart of selecting the cervical patients with PM.
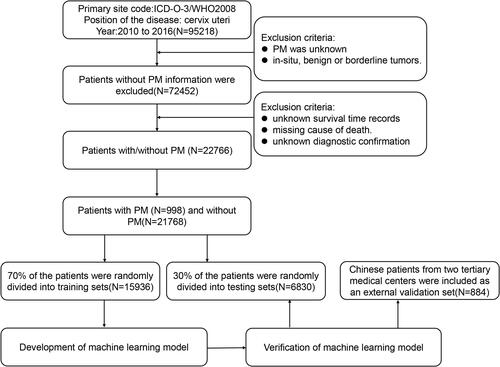
Table 1 Baseline Demographic and Clinical Characteristics of Included Patients Diagnosed with and without PM
Figure 2 Generalized linear model. (A) Nomograms conveying the results of the candidate factors for predicting micrometastasis of lymph nodes. (B) Calibration curves for internal validation of the nomogram. (C) Predicted risk histogram comparing predicted risk of the nomogram with the observed frequency.
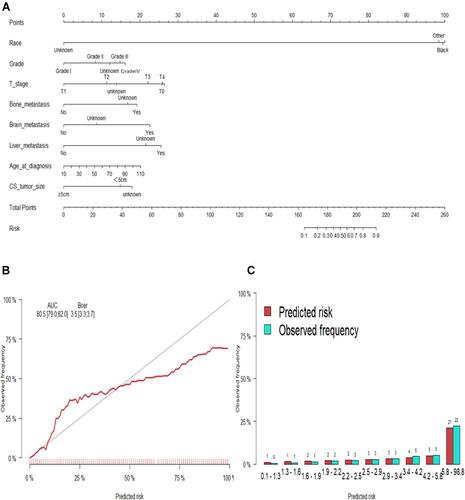
Figure 3 Random forest model. (A) The candidate factors associated with micrometastasis of lymph nodes were ordered according to the mean decreased Gini index. (B) Relationship of dynamic changes between the prediction error and the number of decision trees. (C) Performance of the prediction model with increasing numbers of features in the ROC curve.
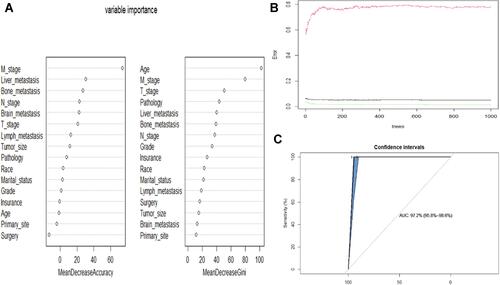
Figure 4 Cox proportional hazard model. (A) Nomograms for 1-, 3-, and 5-year overall survival (OS) prediction. (B) Calibration curves for internal validation of the nomogram. (C) Predicted risk histogram comparing predicted risk of the nomogram with the observed frequency.
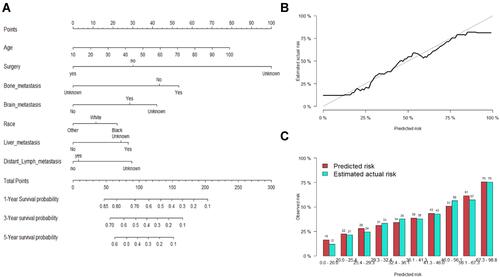
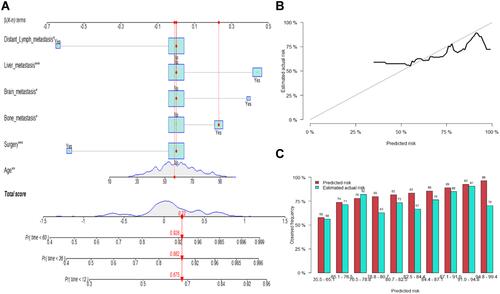
Figure 5 Competitive risk model. (A) Nomogram predicting CSS at 1-, 3- and 5-year using the competitive risk model. According to the Nomogram score, patient No.31 has a cumulative risk of 0.675, 0.882, and 0.928 at 1-, 3- and 5-year, respectively. (B) Calibration curves for internal validation of the nomogram. (C) Predicted risk histogram comparing predicted risk of the nomogram with the observed frequency. *P<0.05; ***P<0.001.