
Figures & data
Table 1 Genotypes Identified Among Alpha-Thalassemia Carriers
Figure 1 Histogram showing number of alpha-thalassemia carriers and negative-for-alpha-thalassemia participants with MCV, MCH and HbA2. Dash lines indicate the cutoff MCV of 80fL, MCH of 27pg and HbA2 of 2.5% used for screening of alpha-thalassemia. The proportions of cases found at below and above these cutoff levels are provided.
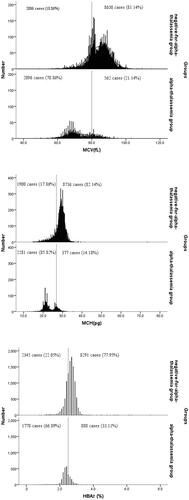
Table 2 Hematological Values for Each Genotype and the Difference Between Groups
Table 3 Detection Rates of the Different Screening Schemes