Figures & data
Figure 1 The research setup. After stratified random sampling, total of 499 primary care patients signed the informed consent and participated in educational interview: first they self-reported any lower urinary tract symptoms, following the education about the clinical manifestations of investigated symptoms. After education, subjects were able to report if they recognized any more of the lower urinary tract symptoms, as well as evaluated bothersome level of each reported symptom.
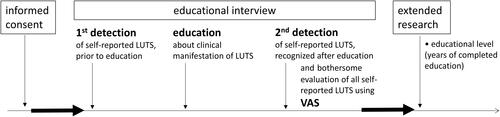
Figure 2 The impact of the educational interview on the recognition of LUTS. The percentages of subjects who reported the presence of urinary problems before and after the educational interview are shown.
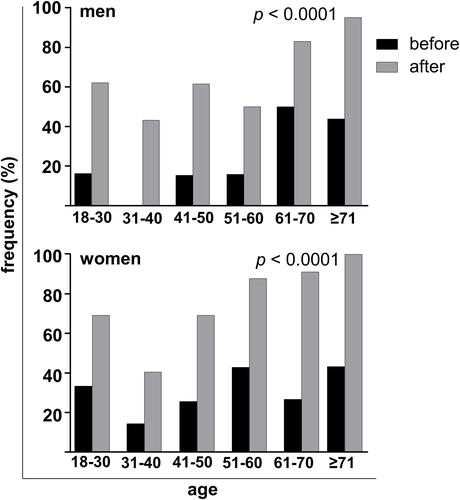
Figure 3 The impact of the number of urinary problems on the recognition of LUTS. (A) Individual results of the subjects: the results of the subjects who recognized and reported LUTS before EI are shown in red. The results of the subjects who recognized the presence of LUTS only after EI are shown in white. (B) Comparison of the number of recognized and reported LUTS before and after the EI. Medians with IQR, and mean value of number of LUT symptoms in the table are shown.
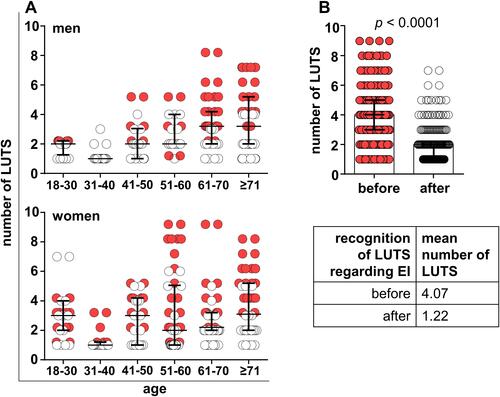
Figure 4 The association between the VAS scores attributed to different urinary problems on the recognition of LUTS. VAS scores of different LUT symptoms recognized before EI and VAS scores of LUT symptoms recognized only after EI are shown. The medians with IQR are shown. Each column represents one LUT symptom: 1) hesitancy, 2) weak stream, 3) feeling of incomplete emptying of the bladder, 4) straining, 5) frequency, 6) nocturia, 7) urgency, 8) urgent incontinency, 9) painful urination, burning, 10) terminal dribble, 11) incontinency.
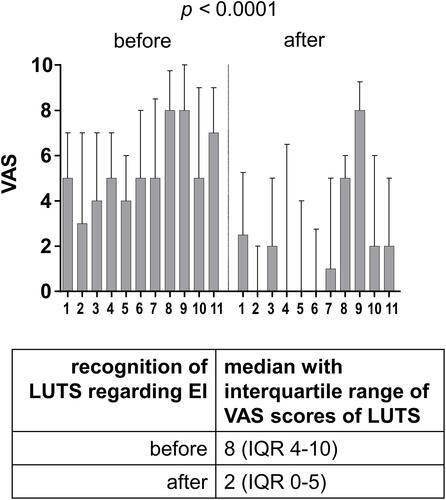
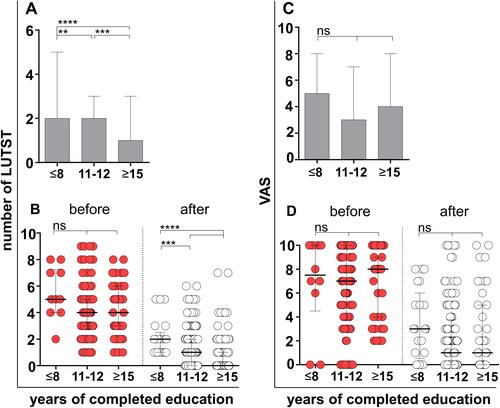
Figure 5 The impact of subjects’ personal education level on the recognition of LUTS. The numbers of LUT symptoms that the subjects recognized and reported, depending on their educational level (A), and the VAS scores shown as medians with IQE (C) are shown. (B and D) Comparison of the numbers of LUT symptoms and their VAS scores in regard to subjects’ personal education level between the subjects that reported LUTS before and after EI. The results of post hoc analysis by Mann–Whitney U-test for (A) ****p<0.0001, ***p=0.0009, **p=0.0096, and for (B) ****p<0.0001 and ***p=0.0080.