113
Views
5
CrossRef citations to date
0
Altmetric
Original Research

Association Between Neutrophil-Lymphocyte Ratio and All-Cause Mortality and Cause-Specific Mortality in US Adults, 1999–2014

, ORCID Icon, , , ORCID Icon, & show all
Pages 10203-10211 | Published online: 22 Dec 2021

Figures & data

Figure 1 Flow chart of inclusion and exclusion of study participants.

Figure 1 Flow chart of inclusion and exclusion of study participants.

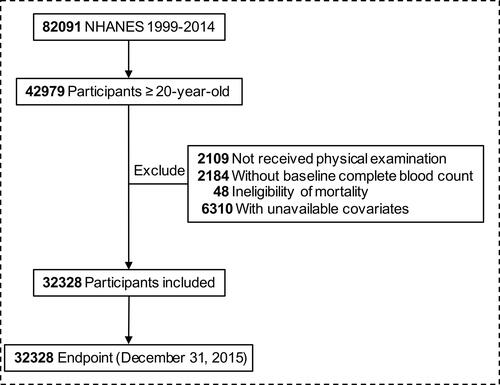
Table 1 Baseline Characteristics of Study Participants According to NLR Levels a

Table 2 Association of NLR Levels with All-Cause Mortality and Cause-Specific Mortality a

Figure 2 Kaplan-Meier Curves for Survival Probability, with Follow-up in Years. Survival according to NLR levels was determined using Kaplan Meier curves. Participants with higher NLR levels (NLR ≥3, red line) had unfavorable prognosis compared with those with lower (NLR < 3, blue line).

Figure 2 Kaplan-Meier Curves for Survival Probability, with Follow-up in Years. Survival according to NLR levels was determined using Kaplan Meier curves. Participants with higher NLR levels (NLR ≥3, red line) had unfavorable prognosis compared with those with lower (NLR < 3, blue line).

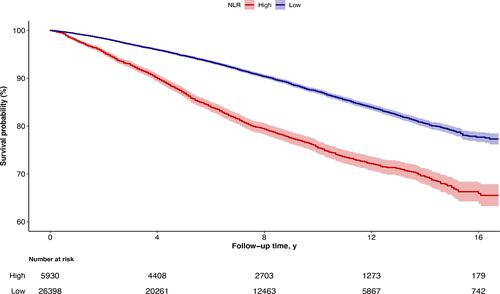
Table 3 Stratified Analyses for the Association of NLR Levels with All-Cause Mortality a