Figures & data
Figure 1 The differential expression of ZWINT between cancer and normal tissues. (A) Expression of ZWINT in tumors of diverse cancer types, compared with the corresponding normal tissues (TIMER2.0). Columns are in grey when normal data are available. *P < 0.05, **P < 0.01, ***P <0.001. (B) A summary of the datasets in which ZWINT were significantly up- (red) or down- (blue) expressed in various cancers, compared with the corresponding normal tissues (Oncomine). The cell color is paralleled with the best gene rank percentile for the analyses within the cell. Numbers in cells represent the counts of datasets. (C–F) Four datasets in which ZWINT was significantly upregulated in HCC, compared with normal liver samples (Oncomine). (G) ZWINT was markedly higher expressed in HCC than normal liver tissues in GEPIA2. *|FC| > 2 and P < 0.001.
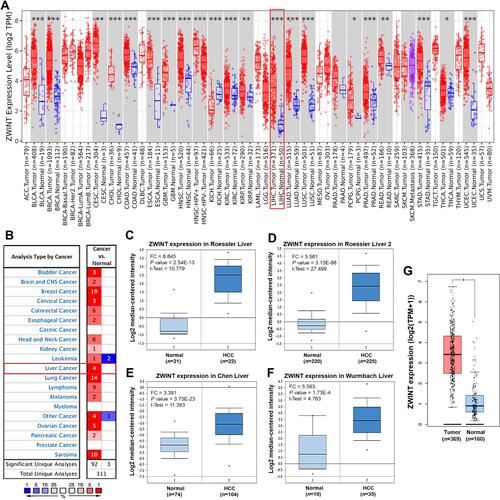
Figure 2 Clinicopathological and prognostic relevance of ZWINT in HCC patients. ZWINT expression in HCC patients with diverse (A) genders, (B) ages, (C) pathological stages, and (D) tumor grades (UALCAN). *P < 0.05, **P < 0.01, ***P < 0.001. (E) The expression of ZWINT in HCC patients with different pathological T stages (LinkedOmics). (F) Survival curves present associations between ZWINT expression with OS, RFS, PFS, and DSS of HCC patients (KM Plotter).
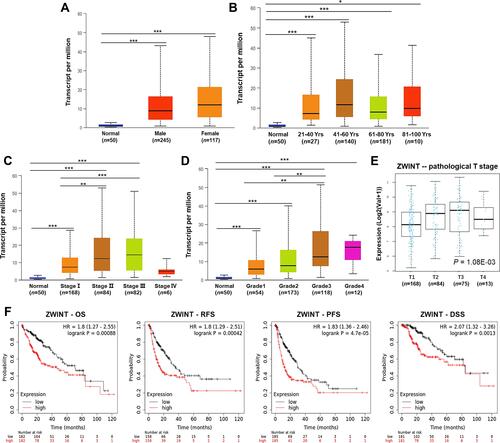
Figure 3 Genetic alternations and DNA methylation of ZWINT in HCC. (A) An overview of genetic alternations of ZWINT in HCC (cBioPortal). (B) The comparison of occurrence rates of vascular invasion between HCC patients with ZWINT altered or not. (C) The influence of the global alternation of ZWINT on the OS of HCC patients. (D) The promoter DNA methylation status of ZWINT in HCC and normal liver samples (UALCAN). (E) Correlations between DNA methylation levels and expression levels of ZWINT in HCC (cBioPortal). (F) A methylated CpG site of ZWINT was significantly associated with the OS of HCC patients (MethSurv).
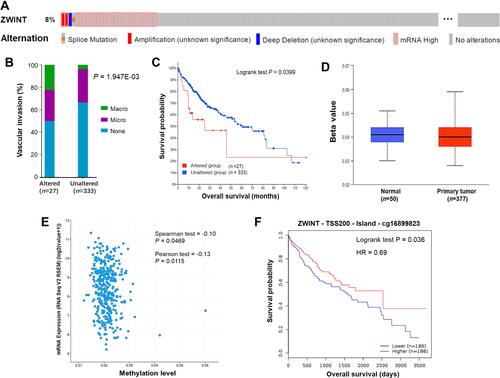
Table 1 Associations Between ZWINT Expression and OS and PFS of HCC Patients with Diverse Clinicopathological Parameters
Figure 4 Correlated genes of ZWINT and the functional annotation based on GSEA. (A) Volcano plots show expressional correlations between ZWINT and its correlated genes in HCC (LinkedOmics). Red and green dots indicate positively and negatively correlated genes respectively. Heat maps showing the top 50 genes that were (B) positively and (C) negatively correlated with ZWINT in HCC (LinkedOmics). The top five significantly enriched (D) GO-BP, (E) GO-CC, (F) GO-MF, and (G) KEGG pathway terms for ZWINT correlated genes based on GSEA. Bars in blue or Orange represent positive or negative enrichment respectively.
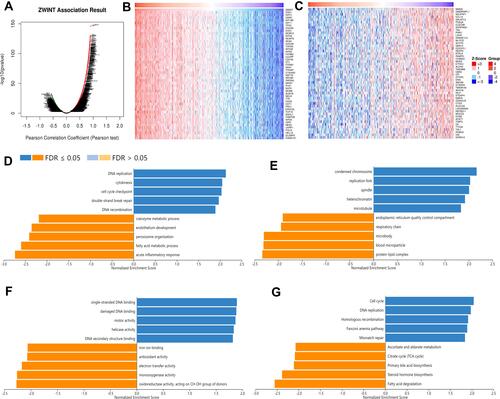
Figure 5 Highly interconnected clusters in the PPI network constructed by the correlated genes of ZWINT. (A) The PPI network constructed by the correlated genes of ZWINT meeting correlation coefficient > 0.5. Nodes in pink or blue represent positively or negatively correlated genes of ZWINT respectively, and node sizes signify degree values. Edges represent interactions among proteins, and edge thicknesses indicate interaction scores. (B) Three clusters with MCODE scores > 9 screened out from the PPI network. The top five GO-BP terms that were significantly enriched for the genes in (C) Cluster 1, (D) Cluster 2, and (E) Cluster 3, respectively.
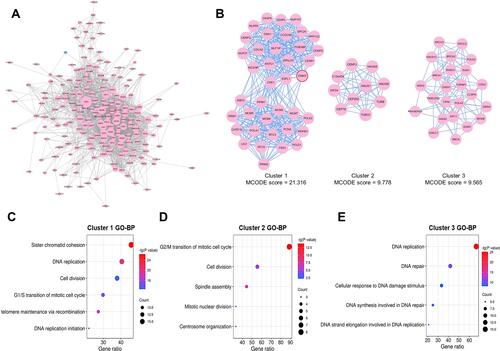
Table 2 The Hub Genes in the PPI Network
Figure 6 Analyses for the hub genes in the PPI network. (A) The top 10 hub genes in the PPI network. Redder colors indicate higher degree values. (B–K) Correlations between expression levels of ZWINT and (B) CDK1, (C) MCM5, (D) KIF11, (E) PCNA, (F) MCM3, (G) MCM4, (H) MCM7, (I) BRCA1, (J) EXO1, and (K) AURKA analyzed using Pearson test (GEPIA2). (L) Impacts of the hub genes on the OS of HCC patients. The results with statistical significance are in bold.
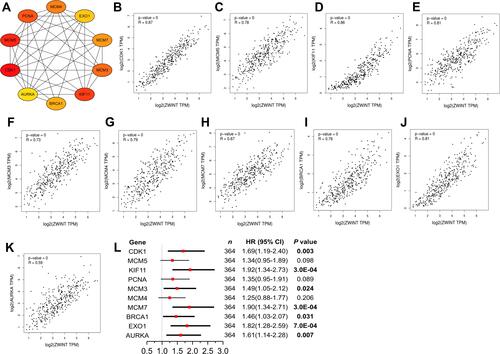
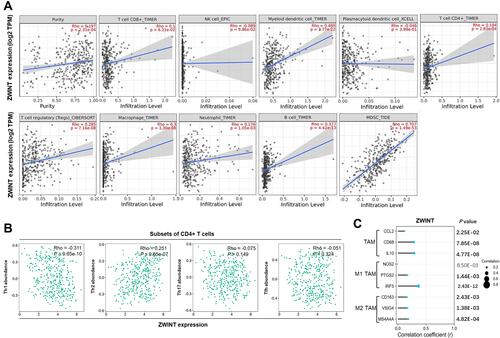
Figure 7 Correlations between ZWINT expression and immune infiltration in HCC. (A) Correlations between ZWINT expression and tumor purity, infiltration levels of CD8+ T cells, NK cells, mDCs, pDCs, CD4+ T cells, Tregs, macrophages, neutrophils, B cells, and MDSCs in HCC (TIMER2.0). (B) Correlations between ZWINT expression and infiltration levels of CD4+ T cell subsets in HCC (TISIDB). (C) Expressional correlations between ZWINT and biomarkers of TAM subsets. P values with statistical significance are in bold.