
Figures & data
Figure 1 Flowchart of patient selection.
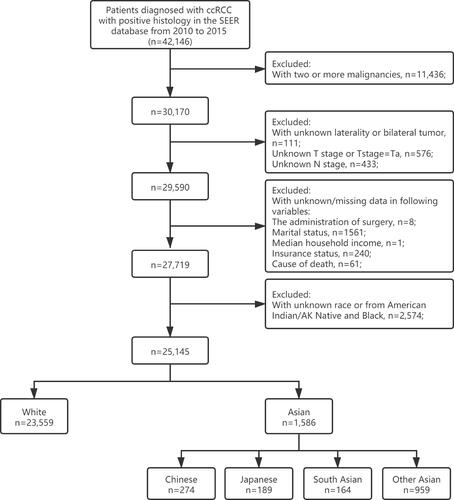
Table 1 Basic Characteristics of Patients with ccRCC in the SEER Database (Asian Vs White)
Table 2 Basic Characteristics of Asian Patients with ccRCC in the SEER Database, Stratified by Race/Ethnicity
Figure 2 Proportional mortality ratios of different CODs (renal cancer vs CVD vs other causes) in Asian-American and White patients with ccRCC.
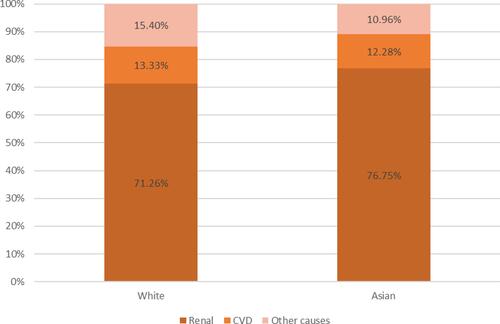
Figure 3 Proportional mortality ratios of different CODs in Asian patients with ccRCC, stratified by race/ethnicity (A), age at diagnosis (B), sex (C), tumor laterality (D), historic stage (E), median household income (F), marital status (G), insurance status (H) and the administration of surgery (I).
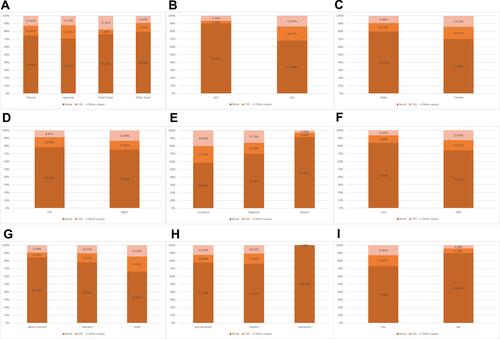
Table 3 Proportional Mortality Ratios of Different Causes of Death in Asian Patients with ccRCC
Figure 4 Kaplan–Meier curves of OS in Asian-patients with ccRCC, stratified by race/ethnicity (A), age at diagnosis (B), historic stage (C), T stage (D), N stage (E), M stage (F), the administration of surgery (G), tumor laterality (H) and sex (I). Younger age at diagnosis, earlier tumor stages (TNM, histological) and the administration of surgery were tightly associated with better OS in Asian-American patients.
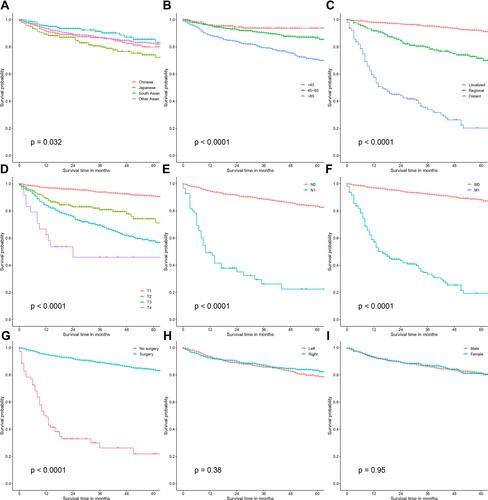
Figure 5 Kaplan–Meier curves of CSS in Asian-American patients with ccRCC, stratified by race/ethnicity (A), age at diagnosis (B), historic stage (C), T stage (D), N stage (E), M stage (F), the administration of surgery (G), tumor laterality (H) and sex (I). Younger age at diagnosis, earlier tumor stages (TNM, histological) and the administration of surgery were tightly associated with better CSS in Asian-American patients.
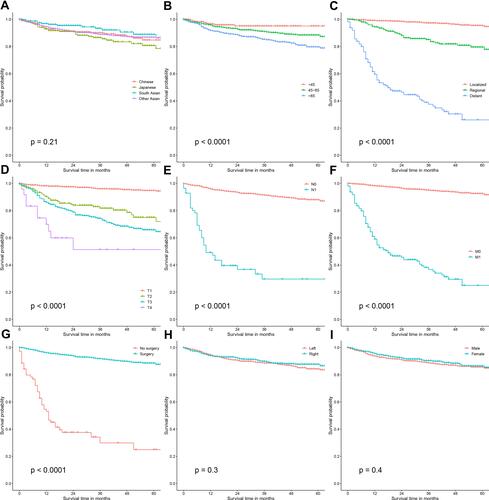
Figure 6 Kaplan–Meier curves of survival outcomes in Asian and White patients with ccRCC. OS before PSM (A), CSS before PSM (B), Asian American patients had comparable OS and CSS when compared with White patients before PSM. OS after PSM (C) and CSS after PSM (D), Asian American patients had comparable OS and CSS when compared with White patients after PSM.
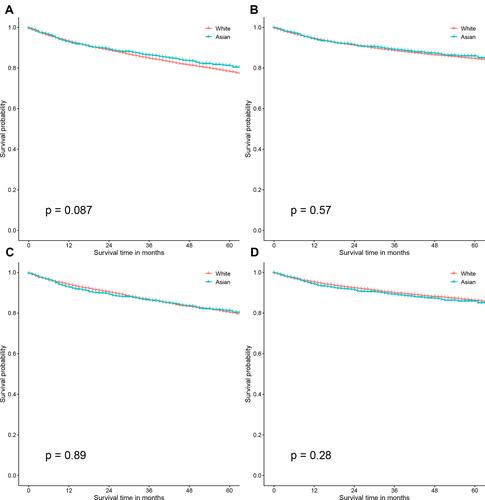
Table 4 Competing Risk Regression Model for Predicting Cancer-Specific Survival in ccRCC Patients