Figures & data
Table 1 Basic Characteristics of the Participants
Table 2 Partial Correlation Analysis of Different Anthropometric Indices and SUA Level
Table 3 Incidence of Hyperuricemia in Quartiles of VAI, LAP and CMI
Figure 1 The incidence of hyperuricemia in per quartile for the CMI, and the Chi-square test results.
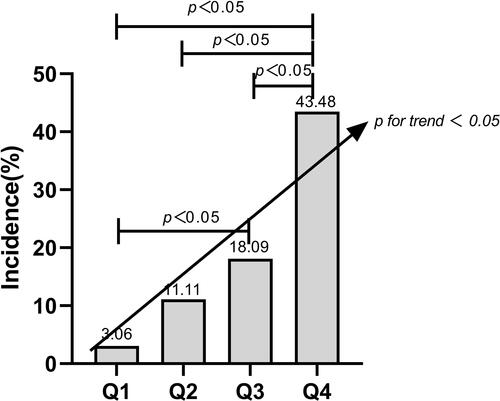
Table 4 Logistic Regression Analysis for Association Between Anthropometric Indices and Hyperuricemia
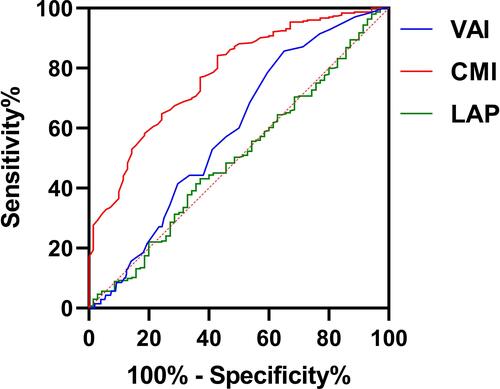
Table 5 ROC Curve of Different Anthropometric Indices Predictive Value for Hyperuricemia
Figure 2 The predictive value of CMI and other anthropometric indices for hyperuricemia.