Figures & data
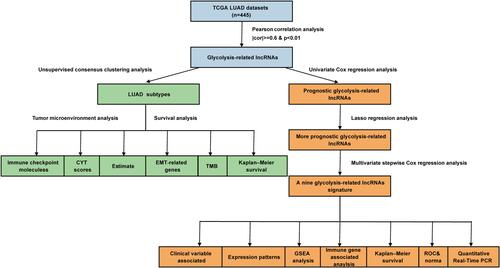
Figure 1 Clinical and molecular characteristics of the LUAD subtypes. (A) Heatmap showing lncRNA expression and clinical characteristics in the three LUAD subtypes. (B) Comparison of clinical characteristics in the three subtypes. *P < 0.05.
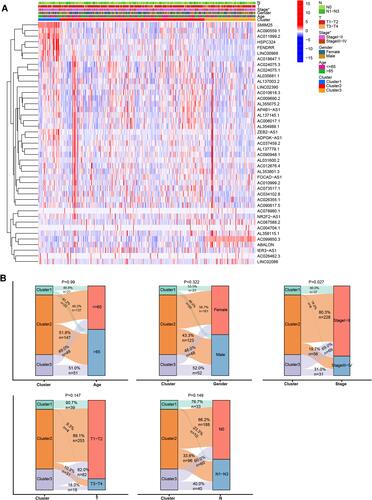
Figure 2 Cluster 1 is a novel inflammatory LUAD subtype. (A) Kaplan–Meier survival curves for the LUAD subtypes. (B) Comparison of CYT scores for the three subtypes. (C) Immune, stromal, and estimate score for the LUAD subtypes. (D) Differences in the expression of immune-target genes between the LUAD subtypes. (E) Differences in TMB between the LUAD subtypes.
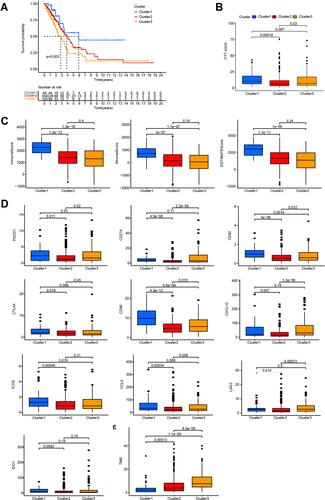
Figure 3 Differences in the expression of EMT-related genes between the LUAD subtypes.
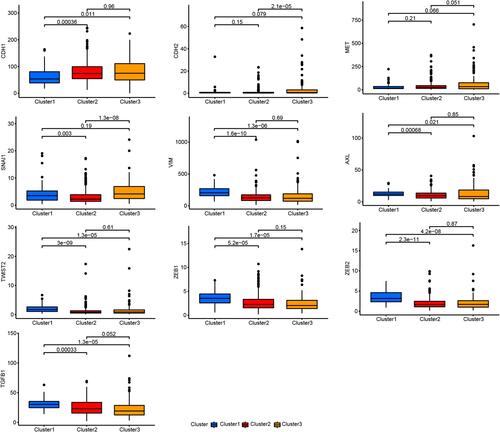
Table 1 Characteristics of the Nine Glycolysis-Related lncRNAs in LUAD
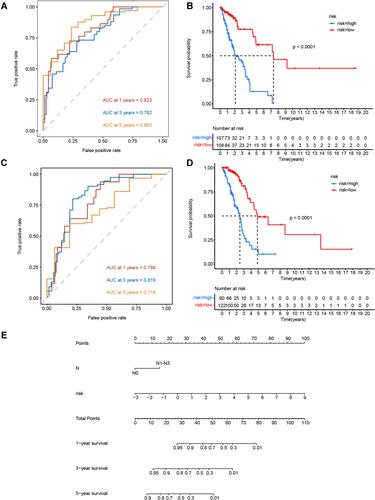
Figure 4 LUAD lncRNA prognostic prediction model. (A and B) AUC value of the ROC curves for the lncRNA risk score in the training set and testing set. (C and D) Kaplan–Meier OS curves for patients in high- and low-risk groups in the training set and testing set. (E) Nomogram from multivariate stepwise Cox regression for 1-, 3-, and 5-year survival.
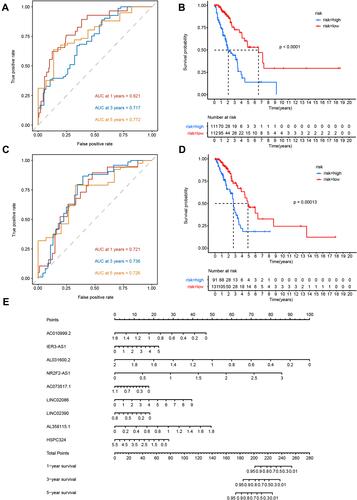
Figure 5 Expression patterns of the nine glycolysis-related lncRNAs. (A) Heatmap of the expression of the nine glycolysis-related lncRNAs in tumor and normal samples. (B) Expression of the nine glycolysis-related lncRNAs in eight pairs of LUAD tumor and normal tissues. *P<0.05, **P<0.01, ***P<0.001.
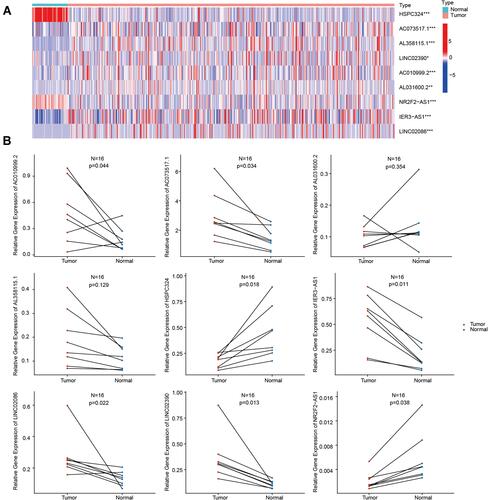
Figure 6 Expression of the nine glycolysis-related lncRNAs across multiple cancer types. *P<0.05, **P<0.01, ***P<0.001, ****P<0.0001.
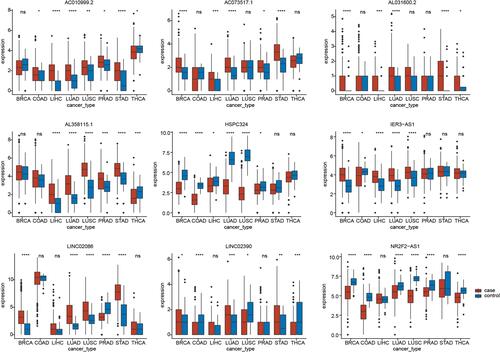
Figure 7 Functional analysis of the nine glycolysis-related lncRNAs. (A) Correlations between the glycolysis-related lncRNAs and immune-related mRNAs. (B) GSEA for high- and low-risk groups.
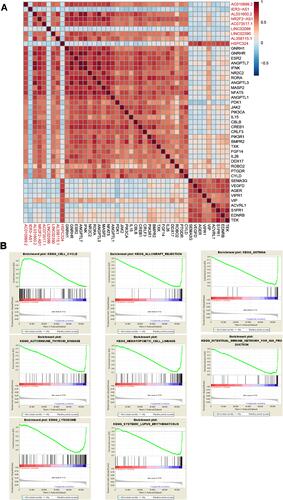
Figure 8 The signature of the nine glycolysis-related lncRNAs was an independent prognostic factor. (A) Comparisons of risk scores in different groups, including patients grouped by LUAD subtype, age, gender, stage, N, and T. (B) Univariate Cox regression analysis between glycolysis-related lncRNAs and clinical characteristics. (C) Multivariate Cox regression analysis between glycolysis-related lncRNAs and clinical characteristics.
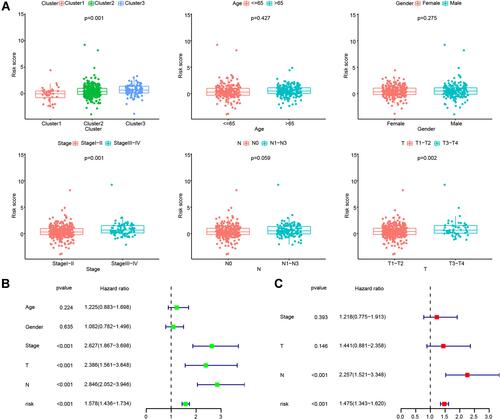
Figure 9 Clinical and lncRNA-based LUAD prognostic prediction model. (A and B) AUC values of the ROC curves for N stage and lncRNA risk score in the training set and testing set. (C and D) Kaplan–Meier OS curves for patients in the high- and low-risk groups in the training set and testing set. (E) Nomogram of multivariate Cox regression for 1-, 3-, and 5-year survival.