Figures & data
Figure 1 Flow chart of patient enrollment and grouping. LVDD+ group: patients diagnosed with LVDD; LVDD– group: patients with normal left ventricular diastolic function.
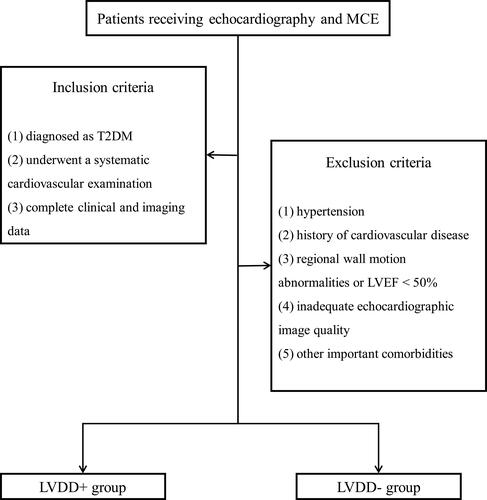
Figure 2 The replenishment curve formed after all microbubbles within an ultrasound field are destroyed by a single ultrasound pulse. It can be described by the following function: , which is used to derive parameters A and β. A is the plateau acoustic intensity reflecting myocardial blood volume, β is the rate of rise of acoustic intensity increase reflecting MP velocity, and A×β is the slope of the tangent to the curve at the origin, representing myocardial blood flow.Citation18
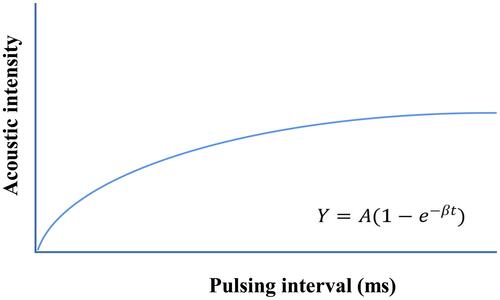
Figure 3 Quantitative MCE analysis in a T2DM patient. Apical 2-, 3-, and 4-chamber views are observed at the end-systolic frame. Five ROIs are placed in the myocardium of the apical segment. The specific positions are as follows: apical septal and lateral segments, as well as apical cap in apical 4-chamber view (A); apical inferior and anterior segments, as well as apical cap apical in 2-chamber view (B); and apical lateral and anterior segments, as well as apical cap in apical long axis view (C). A, β, and A×β in each segment are obtained and all measurements are repeated 3 times to take the average. A represents myocardial blood volume, β represents myocardial perfusion velocity, and A×β represents myocardial blood flow.
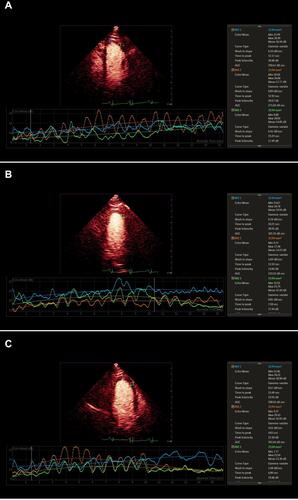
Table 1 Comparison of Clinical Characteristics in T2DM Patients Between LVDD– and LVDD+ Groups
Table 2 Comparison of General Echocardiographic Parameters Between LVDD– and LVDD+ Groups
Table 3 Comparison of MCE Parameters Between LVDD– and LVDD+ Groups
Figure 4 Comparison of MBF (represented by A×β) between LVDD– and LVDD+ groups. Bars represent median with interquartile 25–75. The MBF in the LVDD+ group is significantly lower than in the LVDD– group (P value < 0.05). LVDD+ group: patients diagnosed with LVDD; LVDD– group: patients with normal left ventricular diastolic function.
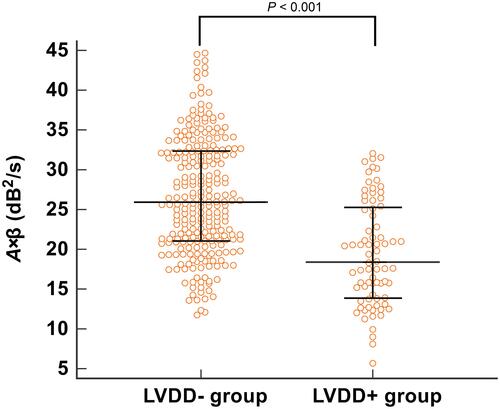
Figure 5 Bland–Altman plots for intra-observer (A) and inter-observer (B) reproducibility of MCE parameter A×β. Both show small standard deviations. A×β represents myocardial blood flow.
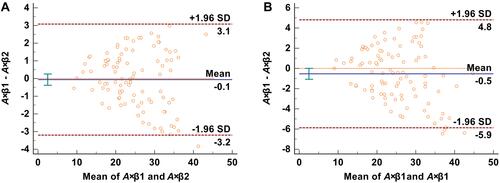
Figure 6 ROC curve of MCE parameter A×β in the diagnosis of LVDD in T2DM patients. A×β represents myocardial blood flow.

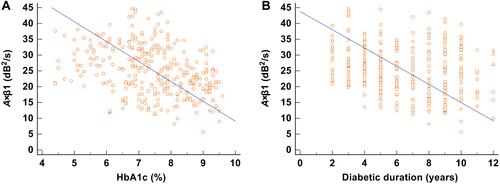
Figure 7 Correlations of A×β with HbA1c (A) and diabetic duration (B). A×β is negatively correlated with HbA1c and diabetic duration (r = −0.226 and −0.350, both P values < 0.001).