Figures & data
Table 1 Characteristics of Patients with LUAD Based on TCGA
Table 2 Correlation Between ADAMTS9-AS2 Expression and Clinical Characteristics in LUAD
Table 3 Correlation of ADAMTS9-AS2 Expression with Clinical Features of LUAD (Logistic Regression)
Figure 1 ADAMTS9-AS2 expression in LUAD is significantly lower than in normal or adjacent normal tissues. (A) Differential expression of ADAMTS9-AS2 in LUAD tissues and adjacent lung tissues. (B) Differential expression of ADAMTS9-AS2 in LUAD tissues and paired adjacent lung tissues. (C) Effectiveness of ADAMTS9-AS2 expression in distinguishing LUAD tissues from nontumor tissues (ROC curve). Significance markers: ***P<0.001.
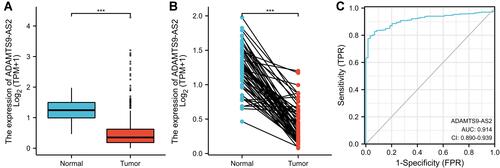
Figure 2 Relationship between ADAMTS9-AS2 expression and clinical features of LUAD. (A) Relationship between ADAMTS9-AS2 expression and N stage. (B) Relationship between ADAMTS9-AS2 expression and gender. (C) Relationship between expression of ADAMTS9-AS2 and number pack years smoked. (D) Relationship between expression of ADAMTS9-AS2 and smoker. Significance markers: *P<0.05; **P<0.01; ***P<0.001.
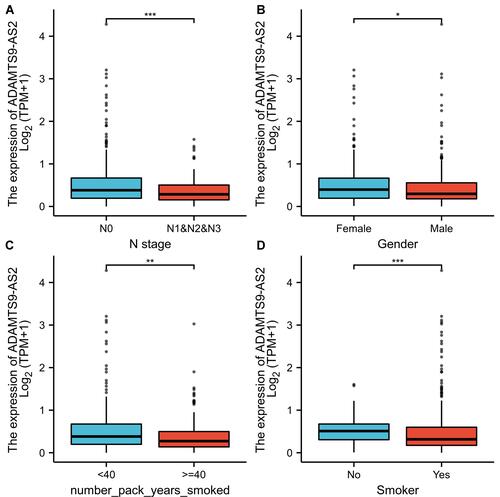
Table 4 Association Analysis of OS and Clinical Characteristics of LUAD Patients (Cox Regression)
Figure 3 Low expression of ADAMTS9-AS2 is associated with poor OS and DSS in LUAD patients. (A) Kaplan–Meier curves and number at risk of OS in LUAD patients. (B) Kaplan–Meier curves and number at risk of DSS in LUAD patients.
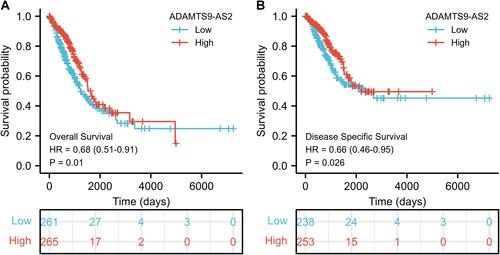
Figure 4 Forest plot of the multivariate Cox regression analysis for LGG.
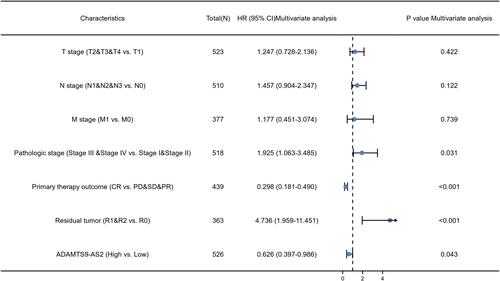
Figure 5 Nomogram for predicting the probability of patients with 1-, 3- and 5-year overall survival.
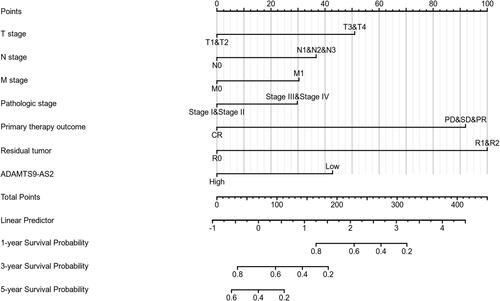
Table 5 Gene Enrichment of ADAMTS9-AS2 High and Low Expression Groups (GSEA)
Figure 6 Enrichment plots from GSEA. (A) Unwinding of DNA, (B) extrinsic pathway, (C) polo-like kinase mediated events, (D) cori cycle, (E) MCM pathway, (F) PCNA-dependent long complement base excision repair, (G) proteasome pathway, (H) lagging strand synthesis, (I) regulation of gene expression in beta cells.
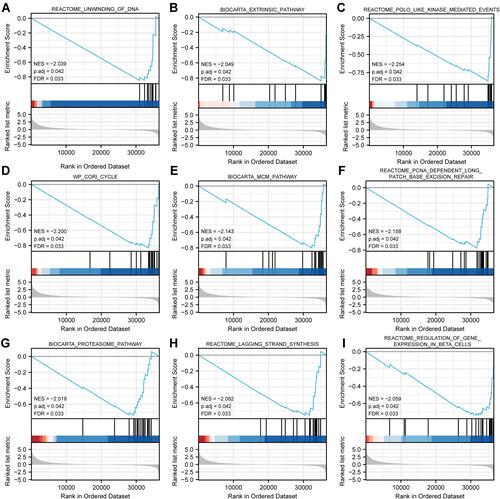
Figure 7 Expression of ADAMTS9-AS2 correlated with immune cells in LUAD patients (grouped comparison chart). (A) DC, (B) Eosinophils, (C) iDC, (D) Macrophages, (E) Mast cells, (F) NK CD56bright cells, (G) NK CD56dim cells, (H) NK cells, (I) pDC, (J) T cells, (K) T helper cells, (L) Tcm, (M) Tem, (N) TFH, (O) Th1 cells, (P) Th2 cells, and (Q) TReg. Significance markers: *P<0.05; **P<0.01; ***P<0.001.
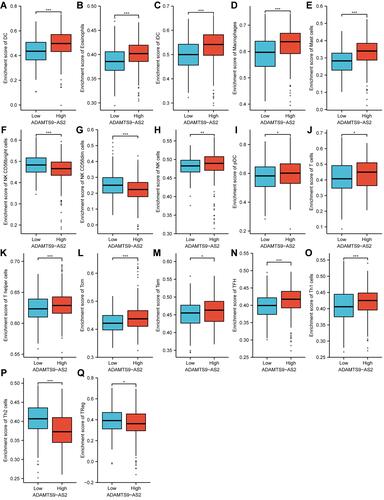
Figure 8 Expression of ADAMTS9-AS2 correlated with immune cells in LUAD patients (scatter plot). (A) DC, (B) Eosinophils, (C) iDC, (D) Macrophages, (E) Mast cells, (F) NK CD56bright cells, (G) NK CD56dim cells, (H) NK cells, (I) pDC, (J) T cells, (K) T helper cells, (L) Tcm, (M) Tem, (N) TFH, (O) Th1 cells, (P) Th2 cells, and (Q) TReg.
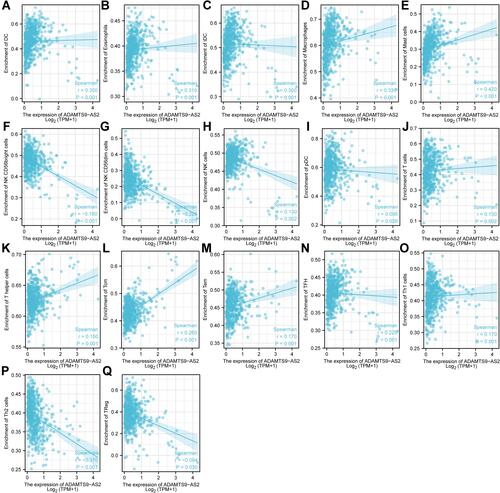
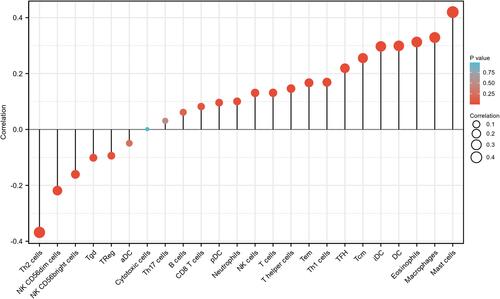
Figure 9 ADAMTS9-AS2 expression correlated with 24 immune cells in LUAD patients (lollipop chart).