Figures & data
Table 1 Univariate Analysis of Control, MMD, and MCA Occlusion Groups
Figure 1 Plasma apelin-13, apelin-17, apelin-36, and serum NO and VEGF levels in patients with moyamoya disease (MMD) or middle cerebral artery occlusion and healthy controls.
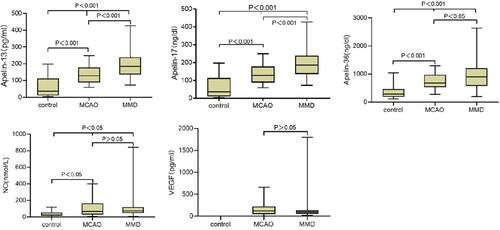
Table 2 Multivariate Binary Logistics Regression Analysis of MMD and MCA Occlusion Groups, MMD Group Was Used as a Reference
Figure 2 Receiver operating characteristic (ROC) curve analyses of apelin-13 (A) and age (B) as predictors of moyamoya disease (MMD) from middle cerebral artery occlusion.
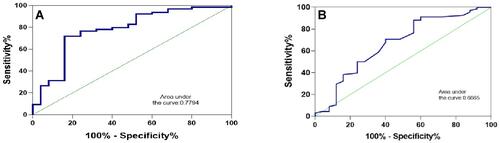
Figure 3 Linear regression analysis of Apelin levels among different grades in the MMD group. As described above, all MMD patients were divided into three levels, and linear regression was performed on apelin-13, apelin-17, and apelin-36 levels. Through a pairwise comparison between the three groups, the results show that apelin-13, apelin-17, and apelin-36 levels increased as the grades rose without exception (***P<0.001, 95% CI of OR are shown inside brackets).
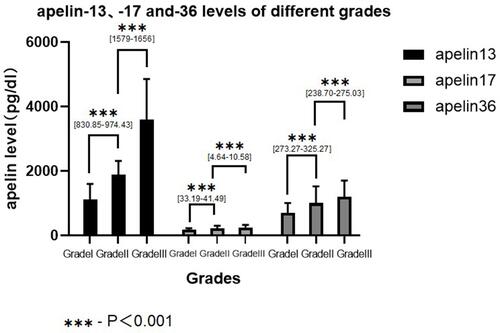
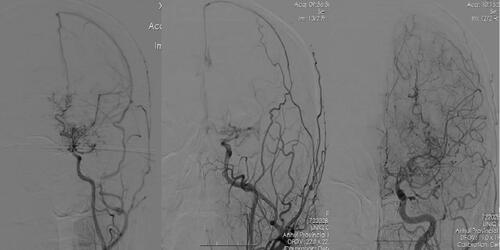
Figure 4 Three DSA images of the included patients with MMD. The compensation gradually improves from left to right (from Grade I to Grade III).