Figures & data
Table 1 Ferroptosis-Related Genes from Downloaded from FerrDb
Table 2 The Clinical Characteristics of Patients with PRCC in the TCGA Dataset
Figure 1 Flowchart of this study.
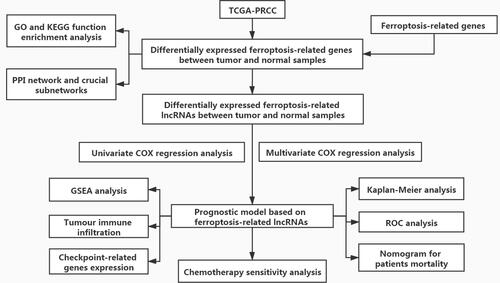
Figure 2 GO and KEGG analyses of differentially expressed ferroptosis-related genes. (A) Functional annotation of differentially expressed ferroptosis-related genes between adjacent normal and tumor samples using GO terms. (B) Functional annotation of differentially expressed ferroptosis-related genes between adjacent normal and tumor samples using KEGG terms.
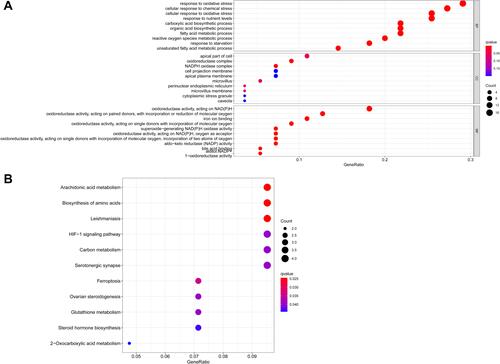
Table 3 Fifteen Prognostic Ferroptosis-Related lncRNAs Identified by Multivariate Cox Analysis
Figure 3 Univariate Cox regression analysis identified 29 ferroptosis-related lncRNAs as independent prognosis predictors of PRCC.
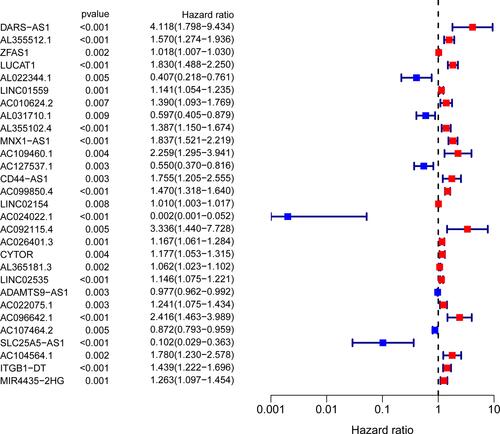
Figure 4 Ferroptosis-related lncRNAs’ prognostic signature in patients with PRCC. (A) Kaplan–Meier survival curve result. (B) AUC values of the risk factors. (C) AUC values at 1, 2, and 3 years (D) Distribution of risk scores of patients with high- and low-risk PRCC based on the ferroptosis-related lncRNAs’ prognostic signature. (E) Scatter plot shows the correlation between the survival status of the high- and low-risk groups. (F) DCA of the risk factors. (G) Heat map of the expression of 15 ferroptosis-related lncRNAs between the high- and low-risk groups.
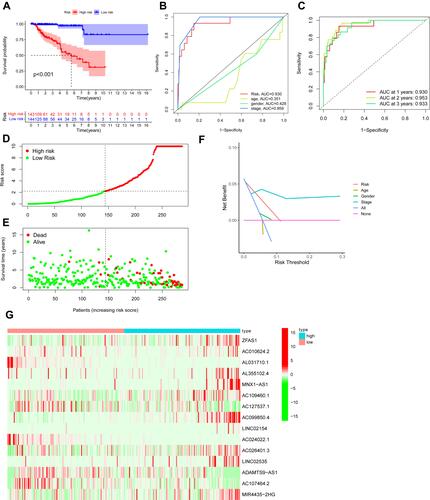
Figure 5 Univariate (A) and multivariate COX (B) analyses between overall survival rate and various clinicopathological parameters. (C) Nomogram for both clinicopathological factors and prognostic ferroptosis-related lncRNAs (*p <0.05; **p <0.01; ***p <0.001).
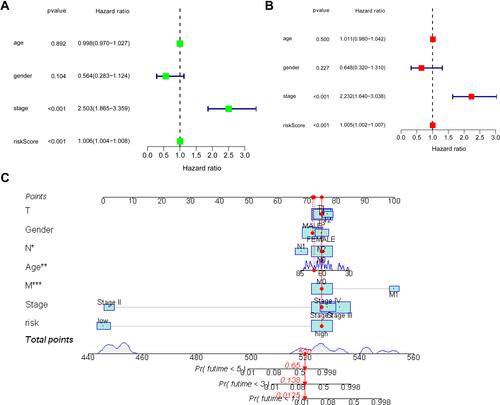
Figure 6 Heatmap for ferroptosis-related lncRNAs’ prognostic signature and clinicopathological manifestations (*p <0.05; **p <0.01; ***p <0.001).
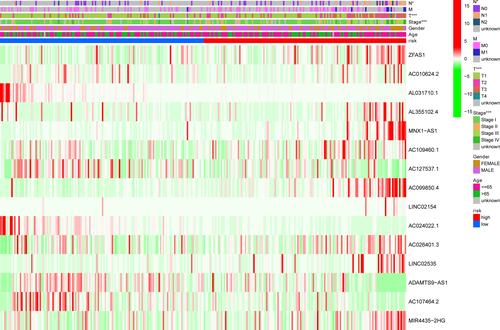
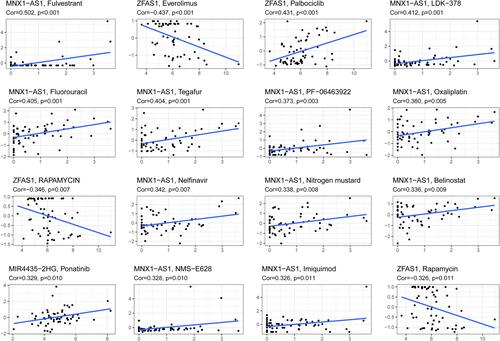
Figure 7 Relationship between the prognostic ferroptosis-related lncRNA and mRNA expression levels.
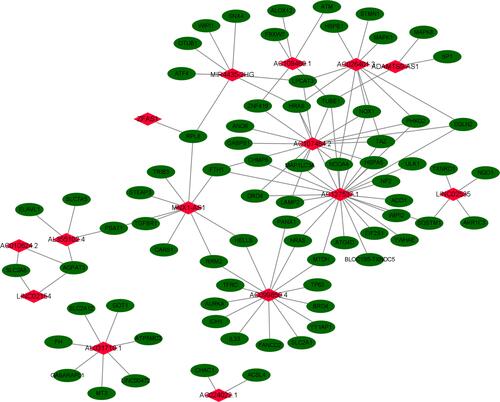
Figure 8 Gene enrichment analysis for prognostic ferroptosis-related lncRNAs.
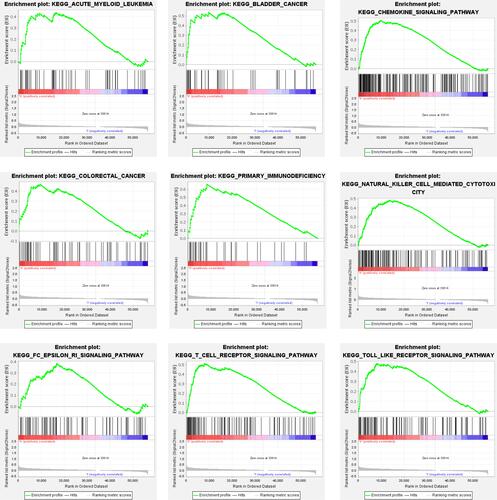
Figure 9 (A) Immune status difference between high-risk and low-risk groups. Heatmap for immune responses based on CIBERSORT, ESTIMATE, MCPcounter, ssGSEA, and TIMER algorithms among high- and low-risk groups. (B) Immune-related function between high- and low-risk groups. (C) Expression of immune checkpoints between high- and low-risk groups. *p <0.05; **p <0.01; ***p <0.001.
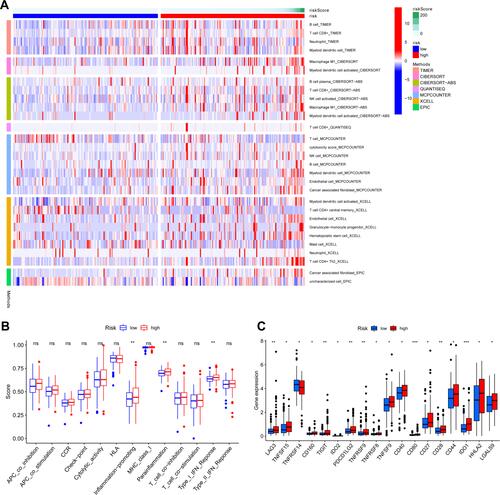
Table 4 Prognostic lncRNAs Expression and Chemotherapy Sensitivity
Figure 10 Prognostic lncRNA expression and chemotherapy sensitivity.