
Figures & data
Figure 1 The participants’ flow chart.
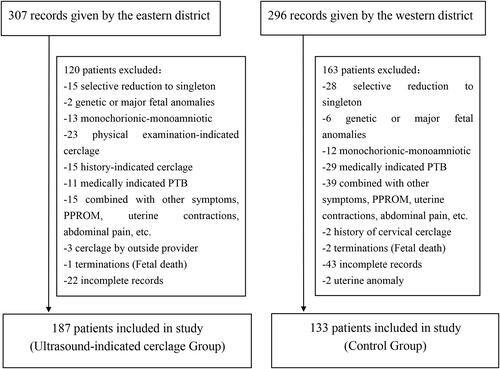
Table 1 Demographic and Gestational Characteristics
Table 2 Delivery and Neonatal Outcomes of Twin Pregnancies with a Short Cervix
Table 3 Logistic Regression Analysis for PTB Risk at <34 Weeks
Table 4 Subgroup Analysis Delivery Outcomes of Twin Pregnancies
Table 5 Subgroup Analysis Neonatal Outcomes of Twin Pregnancies
Figure 2 KM curves generated from CL subgroup analysis. Proportion KM curves in women with twin pregnancy and a short cervix with no delivery across gestation and treated with cervical cerclages (UIC group) compared with the expectant management (control group). CL-based subgroup analysis; (A) showed a CL of ≦15 mm, and (B) showed a CL of >15 mm. Group comparison using the Log rank test showed a significant difference (HR = 1.55; CI = 95% [1.08–2.24]; and p = 0.018) in (A), with no difference between the two groups in (B). Red curve cases with a short cervix treated with ultrasound-indicated cerclage; blue curve cases with expectant management.
![Figure 2 KM curves generated from CL subgroup analysis. Proportion KM curves in women with twin pregnancy and a short cervix with no delivery across gestation and treated with cervical cerclages (UIC group) compared with the expectant management (control group). CL-based subgroup analysis; (A) showed a CL of ≦15 mm, and (B) showed a CL of >15 mm. Group comparison using the Log rank test showed a significant difference (HR = 1.55; CI = 95% [1.08–2.24]; and p = 0.018) in (A), with no difference between the two groups in (B). Red curve cases with a short cervix treated with ultrasound-indicated cerclage; blue curve cases with expectant management.](/cms/asset/6b46c2bb-09a5-45bc-8527-1fbb4c91e335/dijg_a_12168818_f0002_c.jpg)
Figure 3 KM curves generated from subgroup analysis of first short cervix diagnosis GA. Proportion KM curves in twin pregnancies in women with twin pregnancy and a short cervix with no delivery across gestation, treated with cervical cerclages (UIC group) compared with women with expectant management (control group). Subgroup analysis according to the first short cervix diagnosis GA; (A) Showed a GA of ≦24 weeks, and (B) showed a GA of >24 weeks. Group comparison using the Log rank test showed a significant difference (HR = 2.29; CI = 95% [1.61–3.26]); and p = 0.000) in (A) and no difference between in (B). Red curve cases with cerclage, blue curve cases with management treatment.
![Figure 3 KM curves generated from subgroup analysis of first short cervix diagnosis GA. Proportion KM curves in twin pregnancies in women with twin pregnancy and a short cervix with no delivery across gestation, treated with cervical cerclages (UIC group) compared with women with expectant management (control group). Subgroup analysis according to the first short cervix diagnosis GA; (A) Showed a GA of ≦24 weeks, and (B) showed a GA of >24 weeks. Group comparison using the Log rank test showed a significant difference (HR = 2.29; CI = 95% [1.61–3.26]); and p = 0.000) in (A) and no difference between in (B). Red curve cases with cerclage, blue curve cases with management treatment.](/cms/asset/f6e56f0d-886b-4395-9394-fd49d5b53374/dijg_a_12168818_f0003_c.jpg)