Figures & data
Figure 1 Surgical technique. (A) A puncture needle was inserted from the marked skin entry point to the lateral margin of the interlaminar window. (B) Intraoperative lateral fluoroscopic images showing a puncture needle located at the interlaminar window of the L5/S1 level. (C) A working cannula was placed through the obturator from the marked skin entry point to the lateral margin of the interlaminar window. (D and E) Intraoperative AP and lateral fluoroscopic images showing the placement of the working cannula. (F) Incising the ligamentum flavum sequentially using nucleus forceps. (G) Bony resection of inner margin of the superior articular process using a high-speed endoscopic drill system. (H) Removing the intracanal nucleus pulposus by using nucleus forceps. (I) Free movement of S1 nerve root after removal of the herniation. (J) Sequestrated disc pulposus fragments. (K) Operation incision.
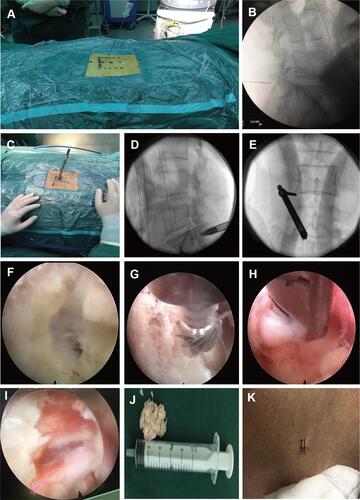
Figure 2 A 28-year-old woman had been suffering from radiating pain in the left leg for seven months. Preoperative sagittal (A) and axial (B) MRI showing huge disc herniation with complete dural sac stenosis at the L4/5 level. Diffusion tensor tractography (C and D), with colored FA scale fiber tracking, distinctly showed abnormalities located at the left L5 and S1 nerve root. Postoperative sagittal (E) and axial (F) MRI shows a large annular defect and partial removal of the nucleus pulposus and the close contact between the annulus fibrosus and the nerve root. Diffusion tensor tractography (G and H) with colored FA scale fiber tracking showed no obvious compression of the left 5 and S1 nerve root. Preoperation vs postoperative 3 months, ODI: 57.78 vs 20; NRS: 7 vs 2; mJOA: 8 vs 16.
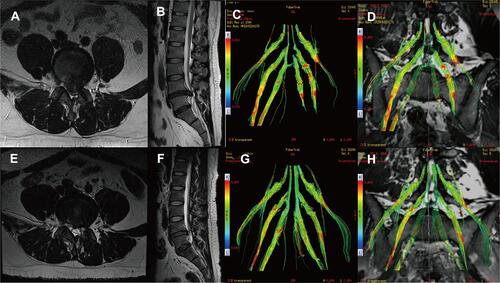
Table 1 Sociodemographic, Clinical Characteristics of the Patients
Table 2 MacNab Criteria
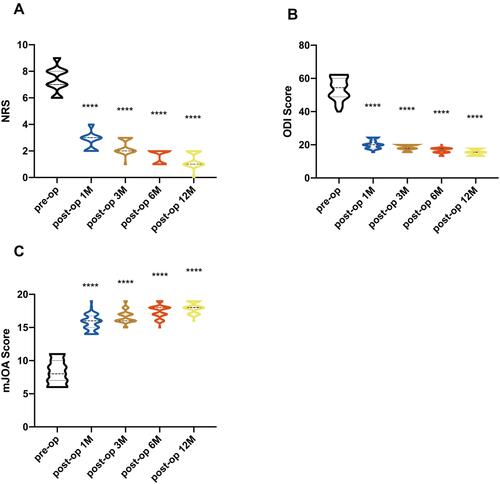
Figure 3 Violin plots of pre- and postoperative 1, 3, 6, and 12 months NRS, mJOA and ODI scores (A–C). The NRS and ODI scores at 1, 3, 6, 12 months postoperatively showed a significant decrease compared to preoperative results (P<0.01). The mJOA score at 1, 3, 6, 12 months postoperatively was significantly higher than the preoperative condition. (****p < 0.0001).