Figures & data

Table 1 Top Ten Hub Genes with Higher Degree of Connectivity
Figure 1 Flow diagram of bioinformatics analysis.
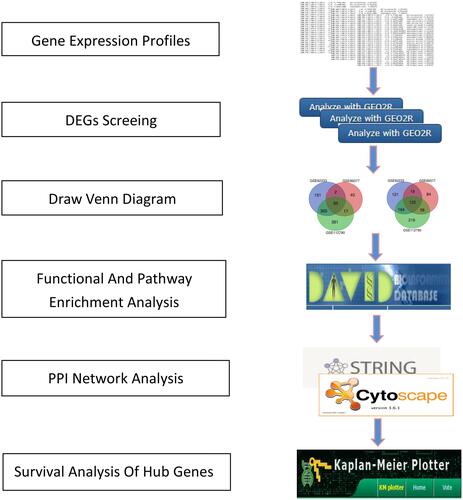
Table 2 Statistics of the Three Microarray Databases Derived from the GEO Database
Figure 2 Venn diagram of DEGs common to all three GEO datasets.
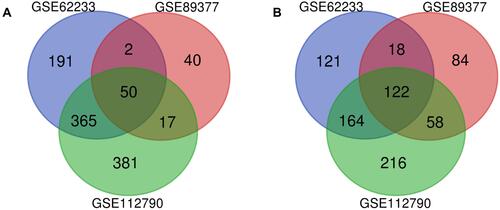
Table 3 Significantly Enriched GO Terms and KEGG Pathways of DEGs
Figure 3 Protein–protein interaction network of the differentially expressed genes in hepatocellular carcinoma.
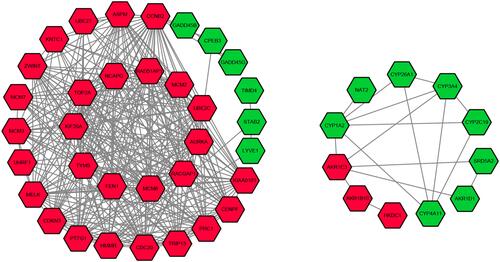
Figure 4 Hub genes screened from protein–protein interaction network.
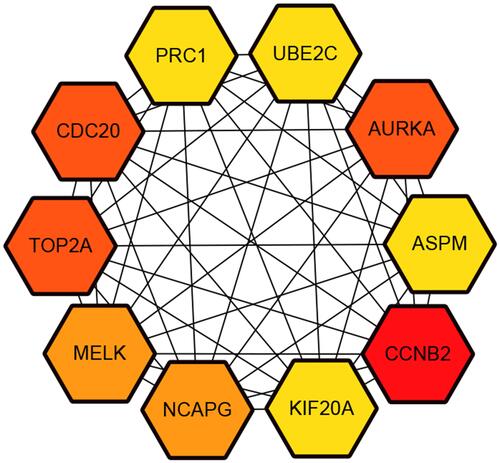
Figure 5 Kaplan–Meier overall survival analyses for the top ten hub genes expressed in hepatocellular carcinoma patients.
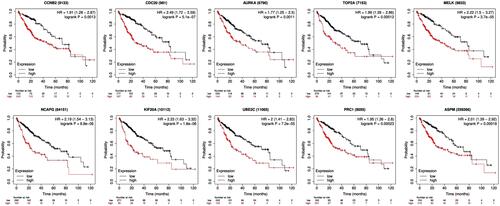
Figure 6 Kaplan–Meier relapse-free survival analyses for for the top ten hub genes expressed in hepatocellular carcinoma patients.
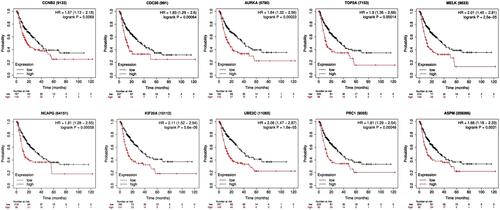
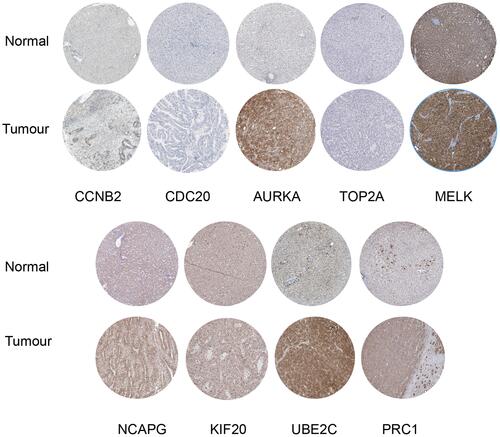
Figure 7 Representative protein expression of the nine hub genes.