
Figures & data
Table 1 Demographics, Weight and Allergy History
Table 2 Blood Testing Results at Admission
Figure 1 Assessment of inflammatory parameters as predictors for AIU. The ROC curve analysis revealed that among the 3 significantly increased inflammatory parameters in children with AIU, baseline NT-proBNP had the highest AUC value in predicting AIU.
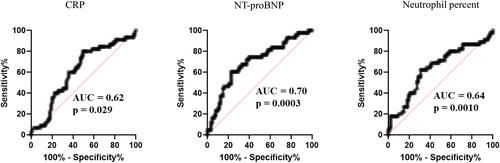
Table 3 Clinical Features and the Length of Hospital Stay