
Figures & data
Table 1 Demographic and Clinical Characteristics
Table 2 Meropenem Use
Figure 1 Trends of meropenem susceptibility rates for P. aeruginosa isolated from the ICU and hospital-wide. (Dashed trendline represents moving average of two consecutive study periods in hospital susceptibility rate).
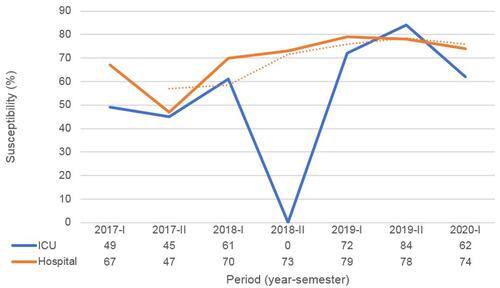
Figure 2 Number of P. aeruginosa isolates collected to generate susceptibility trends in ICU and hospital. (Dashed horizontal gridline indicates the minimum threshold for number of isolates [n = 30]).
![Figure 2 Number of P. aeruginosa isolates collected to generate susceptibility trends in ICU and hospital. (Dashed horizontal gridline indicates the minimum threshold for number of isolates [n = 30]).](/cms/asset/bffaf409-137e-4ddd-801c-149401245a0f/dijg_a_12168694_f0002_c.jpg)
Figure 3 Trend of multidrug-resistant P. aeruginosa rate. (Dashed trendline represents moving average of two consecutive study periods).
Table 3 Analysis of Risk Factors for Meropenem Nonsusceptibility
Table 4 Multivariate Logistic Regression Analysis Identifying Independent Risk Factors for Meropenem Nonsusceptibility