Figures & data
Figure 1 Associations between PLAT expression and clinical–pathological parameters in BC. Low expression of PLAT was observed in tumor tissues both in all samples (A) and paired samples (B). Protein expression of PLAT in normal and primary tumor tissues with CPTAC samples (C). PLAT expression was analyzed in female and male (D), postmenopausal and premenopausal (E) patients, with different histological types (F), including invasive ductal carcinoma (IDC), invasive lobular carcinoma (ILC), and all other specific types, different PAM50 molecular subtypes (G), different tumor size (H) (T1 versus T2, T3, and T4), and different lymph node metastasis status (I) (N0 versus N1, N2, and N3). T1, tumor ≤20 mm in greatest dimension; T2, Tumor >20 mm but ≤50 mm in greatest dimension; T3, Tumor >50 mm in greatest dimension; T4, Tumor of any size with direct extension to the chest wall or the skin (ulceration or macroscopic nodules); invasion of the dermis alone does not qualify as T4; N0, no regional lymph node metastasis; N1, metastases in 1 to 3 axillary lymph nodes; N2, metastases in 4 to 9 axillary lymph nodes; and N3, metastases in 10 or more axillary lymph nodes. The asterisks represent the statistical p-value (ns: p > 0.05, *p ≤ 0.05, **p ≤ 0.01, ***p ≤ 0.001, ****p ≤ 0.0001).
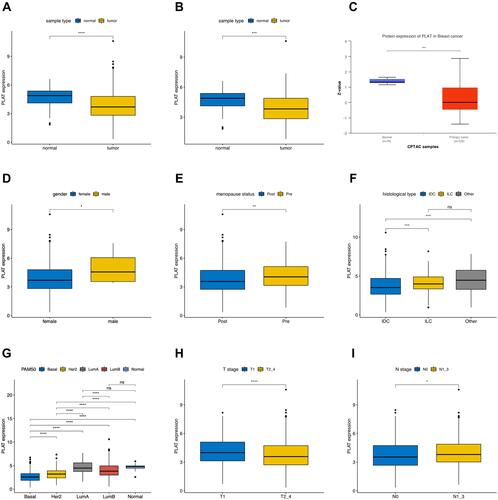
Figure 2 Prognostic value of PLAT expression in BC. (A) Low PLAT expression was associated with a poor OS in BC patients using Kaplan–Meier plotter. (B) DFS had no statistically significant difference in high and low PLAT expression groups. (C) Low PLAT expression was inferred as a poor OS in all luminal samples and all luminal B samples. (D) Forest plots show the association between PLAT expression and clinicopathological features using univariate and multivariate COX hazard analysis.
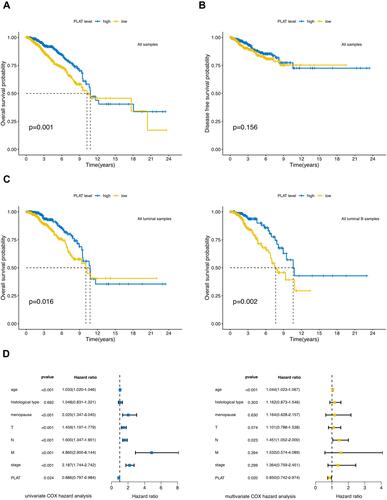
Figure 3 DEGs and enrichment analyses of PLAT in BC. (A) Volcano plot and (B) heatmap show the DEGs in high and low PLAT expression patients. (C) Correlation of PLAT and the top 40 coexpressed genes. (D and E) GO enrichment and KEGG pathway analysis of PLAT in BC. The red box highlights the pathways correlated with BC and immune infiltrates. (F) The GSEA results showed that the terms “antigen processing and presentation,” “natural killer cell mediated cytotoxicity,” “homologous recombination,” and “nucleotide excision repair” were differentially enriched in BC samples with high PLAT.
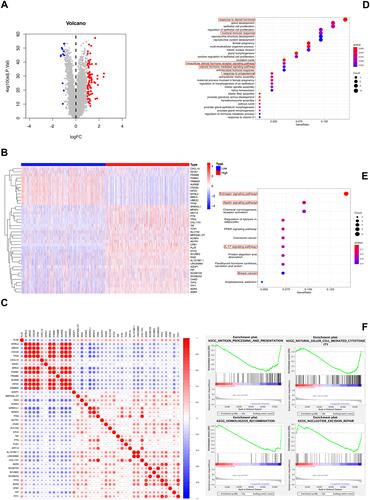
Figure 4 Associations of the PLAT expression level with tumor immune infiltration in BC. (A) Comparison of the enrichment scores of 16 immune cells and 13 immune-related pathways between low- and high-expression groups. (B) The correlation of PLAT expression with infiltration levels of neutrophil, CD4+T cell, B cell, and dendritic cell in BC is available on the TIMER 2.0 database. (C) Correlations between the abundance of tumor-infiltrating lymphocytes (TILs) and PLAT (plus the four TILs with the highest correlation) in the TISIDB database. (D–F) Correlations between immunomodulators and PLAT (plus the four immunomodulators with the highest correlation, respectively) in the TISIDB database. (G and H) Correlations between chemokines (or receptors) and PLAT (plus the four chemokines (or receptors) with the highest correlation, respectively) in the TISIDB database. The asterisks represent the statistical p-value (*p ≤ 0.05, **p ≤ 0.01, ***p ≤ 0.001).
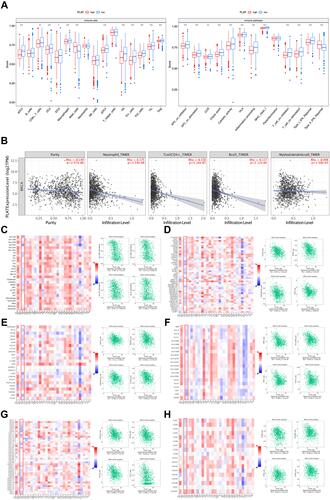
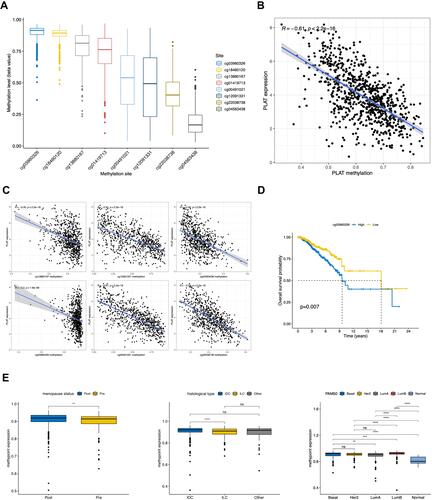
Figure 5 Correlation of DNA methylation level with PLAT expression and clinical features. (A) Methylation level of 8 methylation site in PLAT. (B) Correlation of PLAT expression with gross methylation level. (C) Correlation of PLAT expression with different methylation sites (cg13880167, cg12091331, cg04563438, cg03960326, cg00491021, and cg22038738). (D) High methylation level of cg03960326 site was associated with a poor OS in BC patient. (E) Methylation level of cg03960326 site was analyzed with different menopausal status, histological types and PAM50 molecular subtypes. The asterisks represent the statistical p-value (ns: p > 0.05, **p ≤ 0.01, ***p ≤ 0.001, ****p ≤ 0.0001).