Figures & data
Table 1 The Clinical Characteristics of BC Patients (TCGA)
Figure 1 Expression of ORCs in various tumors and their prognostic value in BC. (A) Comprehensive analysis of ORCs mRNA expression in various tumor tissues compared with normal tissues using Oncomine database. The left box in red indicated the number of datasets with high expression and the right box in blue indicated the number of datasets with low expression after comparing cancerous and normal tissues. (B) The Kaplan–Meier curve for OS of BC patients with high and low ORCs mRNA expression from Kaplan–Meier Plotter.
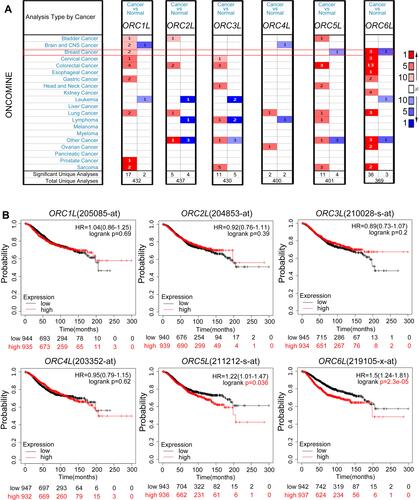
Figure 2 mRNA and protein expression of ORCs in BC. (A) Relative mRNA expression of ORCs in human BC and normal tissues obtained from TCGA. (B and C) Relative mRNA expression of ORCs in human BC and normal tissues obtained from GEO (GSE54002, GSE37751). (D) ORCs protein expression in BC and normal tissues from UALCAN cancer OMICS data. n=number of cases. P-value < 0.05 was considered statistically significant.
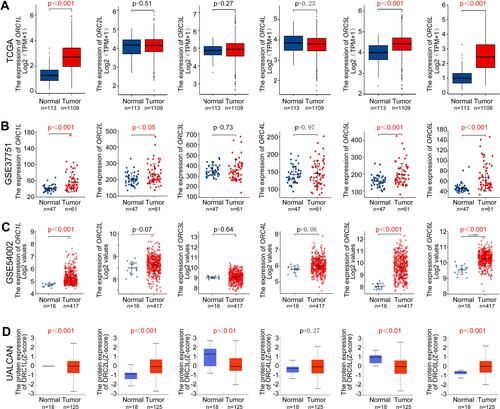
Figure 3 Relationship between the ORCs and clinicopathological features in BC. (A) The relationship between ORC1L and age, molecular subtype, T stage, N stage, M stage, and pathologic stage. (B) The relationship between ORC5L and age, molecular subtype, T stage, N stage, M stage, and pathologic stage. (C) The relationship between ORC6L and age, molecular subtype, T stage, N stage, M stage, and pathologic stage. n=number of cases. P-value < 0.05 was considered statistically significant.
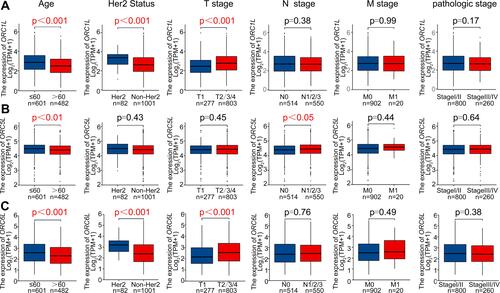
Figure 4 Diagnostic and prognostic values of ORC1L, ORC5L and ORC6L in BC. (A) The ROC was plotted to estimate the diagnostic value of ORC1L, ORC5L and ORC6L expression in BC. (B) Kaplan–Meier method illustrated the impacts of ORC1L, ORC5L, and ORC6L on OS.
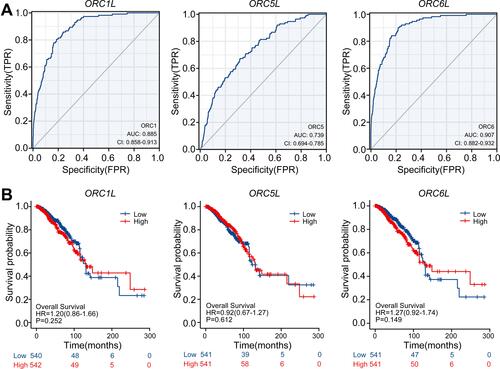
Table 2 Univariate and Multivariate Cox Regression for OS in BC Patients (TCGA)
Figure 5 Multivariate Cox regression analysis and Nomogram. (A) ORC6L, age, molecular subtype, T stage, N stage, M stage, and pathologic stage were included to multivariate cox regression analysis. (B) According to the nomogram, the total score was obtained after adding up the scores of each factor. The probability corresponding to the total score on the scale was the 1-year, 3-year and 5-year survival probability. (C) The calibration plot showed the mean predicted probabilities close to observed probabilities.
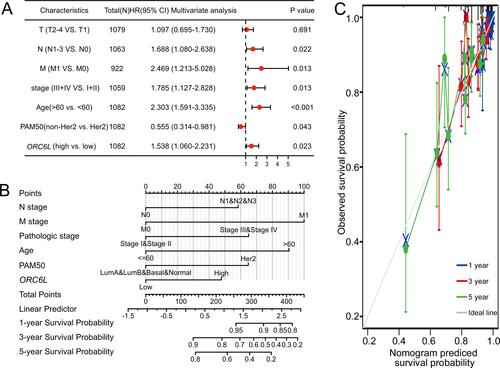
Table 3 Signaling Pathways Enriched in the ORC6L High-Expression Group in BC Patients (TCGA)
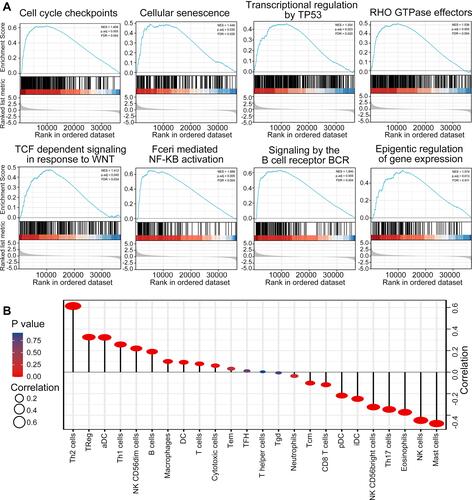
Figure 6 GSEA and Immune Cells Infiltration. (A) Gene set differences between ORC6L high and ORC6L low human BC specimens revealed by GSEA. 14 biological pathways were found obviously enriched in ORC6L high BC specimens. A gene set with P ≤ 0.05 was considered to be significantly enriched. (B) Correlation between ORC6L expression and immune cells infiltration in BC. Coefficient of correlation |r|>0.3, P-value < 0.05 was considered statistically significant.