Figures & data
Figure 1 Distribution of sickle-cell anemia cases in the municipalities of Mato Grosso do Sul, Brazil, between 1980 and 2018, per 100,000 inhabitants (n=125).
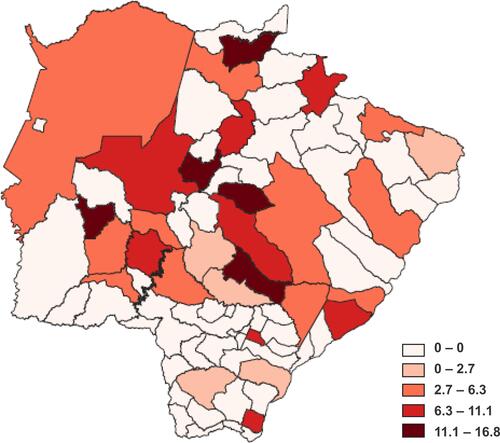
Figure 2 Frequency and incidence (100,000 inhabitants) of the sickle-cell anemia cases stratified in decade of birth, monitored in Mato Grosso do Sul, Brazil (n=128).
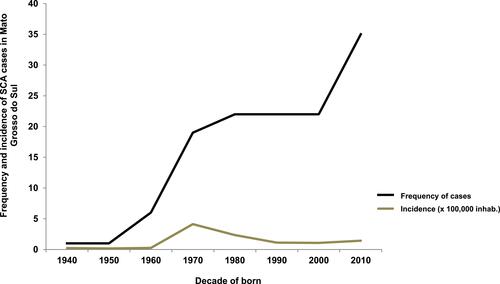
Figure 3 Data on the total and number of days of hospitalization of the cohort in clinical ward and intensive care center, Campo Grande, Mato Grosso do Sul, Brazil (n=128).
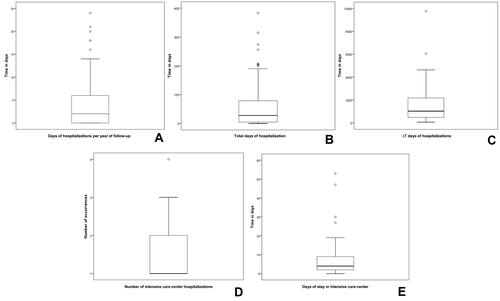
Figure 4 Percentage of cases with laboratory levels outside of the normal range, Campo Grande, Mato Grosso do Sul, Brazil (n=128).
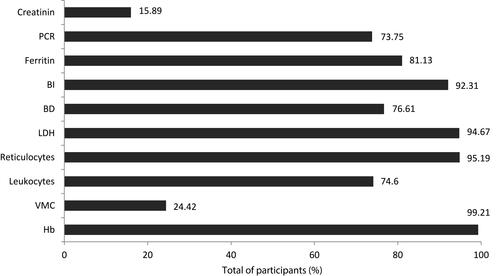
Figure 5 Distribution of laboratory marker values from the cohort, Campo Grande, Mato Grosso do Sul, Brazil (n=128).
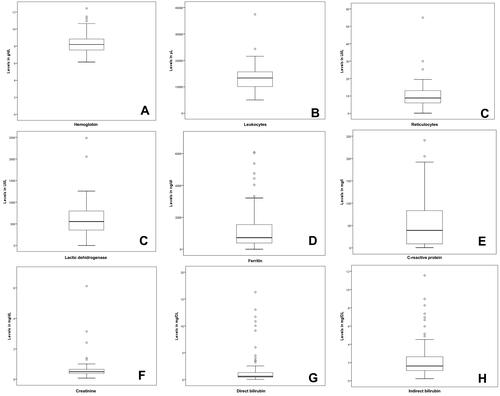
Table 1 Main Clinical Complications of Patients with Sickle-Cell Anemia, Before and After the Use of Hydroxyurea, Monitored Between 1980 and 2018. Mato Grosso do Sul, Brazil, 2020 (n=128)
Figure 6 Data from the patients with sickle-cell anemia stratified by moments before and after the use of hydroxyurea.
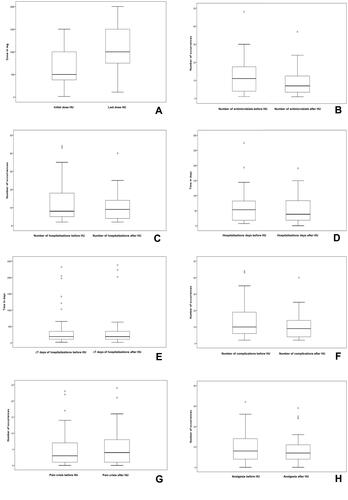
Table 2 Use of Antimicrobials in the Periods Before and After the Use of Hydroxyurea in Patients with Sickle-Cell Anemia, Monitored Between 1980 and 2018. Mato Grosso do Sul, Brazil, 2020 (n=128)
Table 3 Causes of Death Stratification by Age at the Time of Death. Mato Grosso do Sul, Brazil, 2020 (n=19)
Table 4 Number of Deaths According to the Demographic and Clinical Data of Patients with Sickle-Cell Anemia, Monitored Between 1980 and 2018. Mato Grosso do Sul, Brazil, 2020 (n=128)
Table 5 Number of Deaths According to Medication Use and Procedures Performed in Patients with Sickle-Cell Anemia, Mato Grosso do Sul, Brazil, 2020 (n=128)
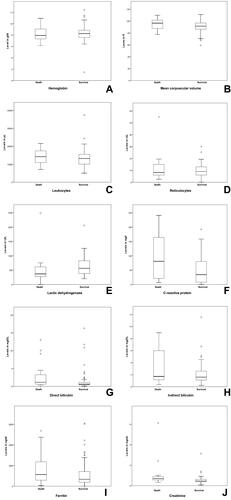
Figure 7 Distribution of values for laboratory markers between cases that died and those that survived, Campo Grande, Mato Grosso do Sul, Brazil (n=128).