
Figures & data
Table 1 Demographical Characteristics and Clinical Data of the Patients
Table 2 Diagnostic Performances of SII, PLR, and NLR for Distinguishing Between MAP & SAP
Figure 1 Receiver operating characteristic (ROC) curve analysis for assessing the performance of the SII, PLR, and NLR in determining the severity of acute pancreatitis.
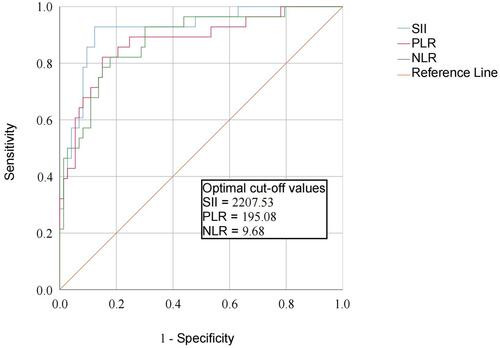
Table 3 Multivariate Logistic Regression for Severe Acute Pancreatitis