Figures & data
Figure 1 Study flowchart.
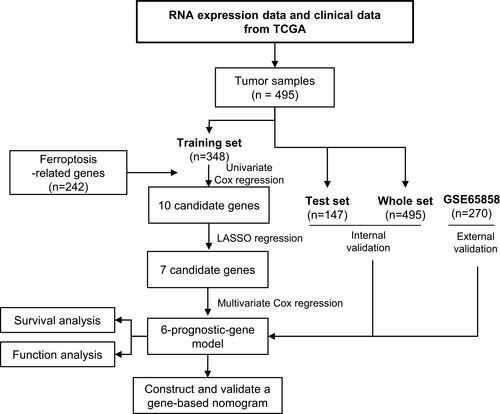
Figure 2 Identification of six significant prognostic genes in HNSCC. (A) Univariate Cox regression analysis of 242 ferroptosis-related genes. (B) LASSO coefficient profiles of 10 prognostic genes. (C) LASSO regression with tenfold cross-validation yielded seven prognostic genes using the minimum lambda value. (D) Multivariate Cox regression analysis of six prognostic genes.
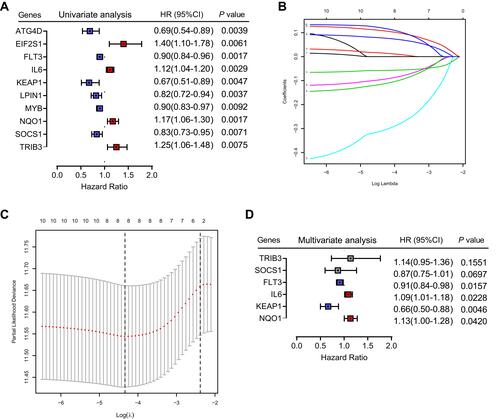
Figure 3 Prognostic analysis of the six-gene signature in the training set. (A) The curve of risk score. The dotted line represents the median risk score, and patients were divided into high- and low-risk groups. (B) Survival status of the patients. A higher risk score corresponded to higher mortality among patients. (C) Heatmap of six prognostic gene expression profiles in the high- and low-risk groups. (D) Kaplan–Meier survival analysis of the signature of six genes. (E) Time-dependent receiver operating characteristic analysis of the six-gene signature.
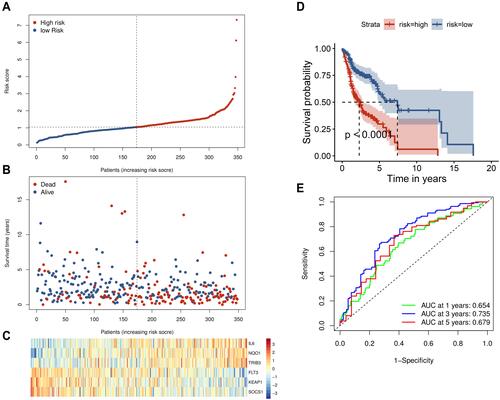
Figure 4 Validation of the six-gene signature. The external validation set analysis from GSE65858. Kaplan–Meier survival analysis was performed for the six-gene signature in the internal validation set (A) the entire set (B) and the external validation set (C). Time-dependent receiver operating characteristic analysis of the six-gene signature was used in the internal validation set (D) the entire set (E) and the external validation set (F).
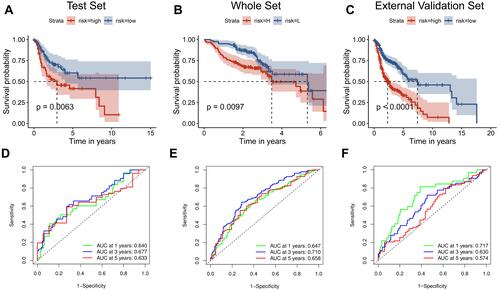
Figure 5 Identification of the independent prognostic parameters and construction of a gene-based prognostic model. (A) Forest plot of univariate Cox regression analysis in HNSCC. (B) Forest plot of multivariate Cox regression analysis in HNSCC. (C) ROC analysis indicated that risk score and age were accurate variables for survival prediction. (D) Formula to build the models. (E–G) Calibration curves showed the concordance between 1-, 3- and 5-year OS prediction and observation of the two models. (H) ROC analysis showed that the model combining M stage and risk score was an accurate variable for survival prediction. (I) Nomogram integrating six gene-based M stages and a risk score.
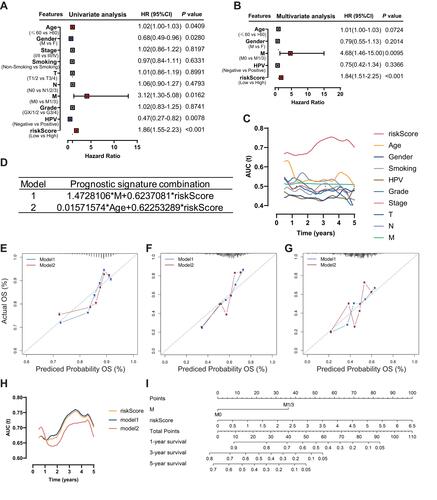
Figure 6 Performance of the gene-based nomogram in predicting survival probability and comparison of the predictive power among the gene-based nomogram, stage, and risk score. Time-dependent ROC curves of the nomogram and risk score in 1-, 3- and 5-year OS prediction in the training set (A–C), the internal validation set (D–I) and the external validation set (J–L).
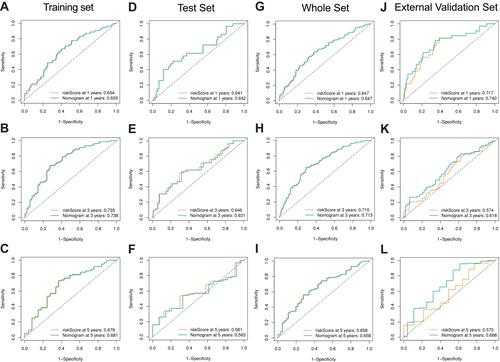
Figure 7 Functional enrichment analysis of the six-gene signature. Gene set enrichment analysis (GSEA) results in the training set (A) and external validation set (B) show the enriched signaling pathways associated with the six-gene signature. The epithelial-mesenchymal transition signaling pathway in the high-risk training set (C) and external validation set (D). Comparison of EMT scores between high- and low-risk groups in the training set (E).
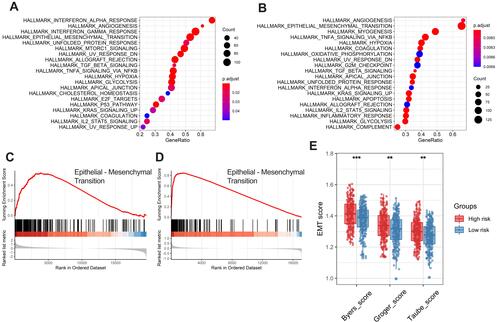
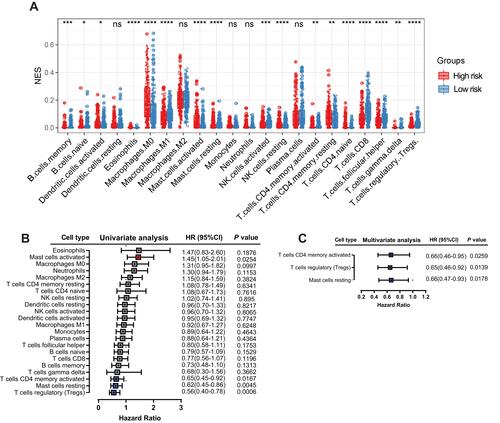
Figure 8 Correlation between immune infiltration and the six-gene signature. Relative abundance of immune cell types in the high- and low-risk groups (A). Univariate (B) and multivariate (C) Cox regression analyses showed that activated memory CD4 T cells, regulatory T cells and resting mast cells were positive independent prognostic factors.