Figures & data
Figure 1 Analysis workflow of this study.
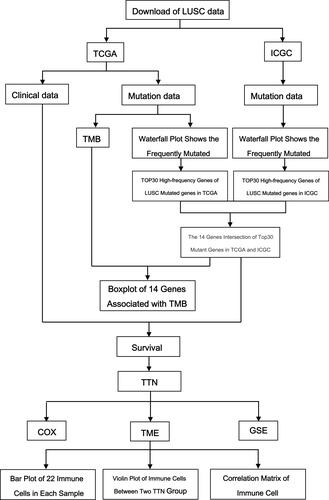
Figure 2 Landscapes of frequently mutated gene in LUSC. (A) Oncoplot depicts the frequently mutated genes in LUSC form TCGA cohort. The left panel shows mutation frequency, and genes are ordered by their mutation frequencies. The right panel presents different mutation types. (B) Waterfall plot displaying the frequently mutated genes in LUSC from the ICGC cohort. The left panel shows the genes ordered by their mutation frequencies. The right panel presents different mutation types.
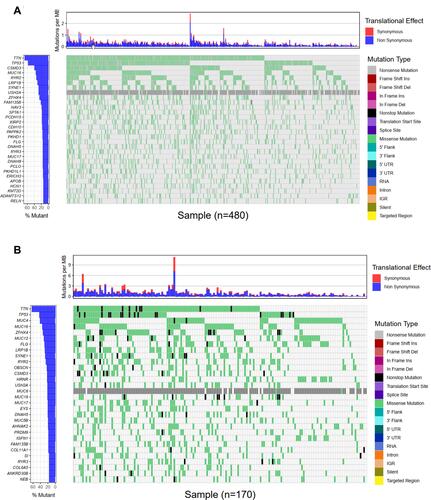
Figure 3 Gene mutations are associated with TMB. (A) Venn diagram shows 14 frequently mutated genes covered by the TCGA and ICGC cohorts. (B) Fourteen genes with high mutation frequency are associated with TMB (***p < 0.001).
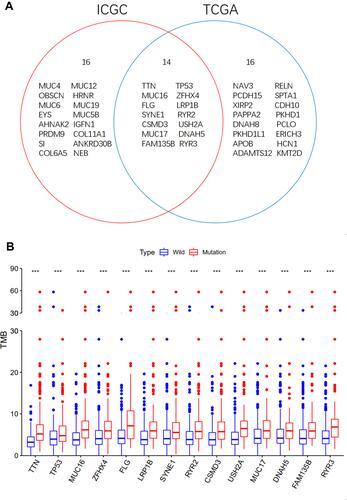
Table 1 Univariate and Multivariate Overall Survival Analysis of LUSC Patients by the COX Proportional Hazards Model
Figure 4 TTN mutation is associated with clinical prognosis. Kaplan Meier survival analysis was used to determine survival curves that reflect the association between gene mutations and prognosis. The p-value is shown each plot.
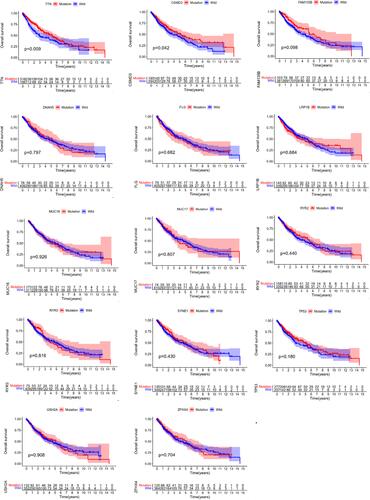
Figure 5 Significantly enriched pathways associated with TTN mutation. GSEA was performed with TCGA to explore the function role of TTN mutation. The GSEA analysis showed that samples with FAT3 mutation enriched in (A) glycosphingolipid biosynthesis ganglio series, (B) intestinal immune network for iga production, (C) leukocyte transendothelial migration, (D) lysosome, (E) vascular smooth muscle contraction.
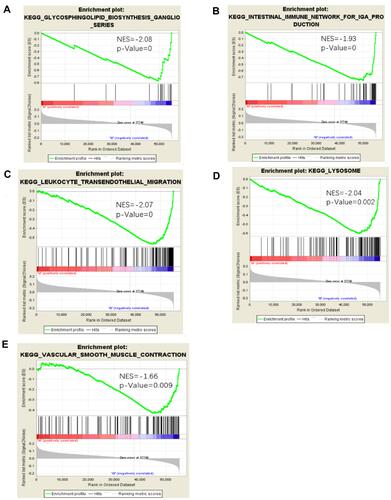
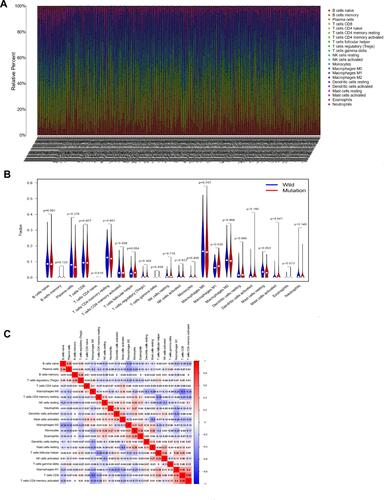
Figure 6 TTN mutation is correlated with tumor-infiltrating immune cells. (A) The stacked bar chart shows the distribution of 22 immune cells in each sample. (B) Violin plot displaying the differentially infiltrated immune cell between the TTN-mutant groups and the TTN-wild group, and blue represents the TTN-wild group, and red color represents TTN-mutation group. The p-value is shown in the figure. (C) Correlation matrix of immune cell proportions. The red color represents a positive correlation, and the blue color represents a negative correlation.