Figures & data
Table 1 Patient Characteristics for 3-Year and 5-Year OS and GCSS of Elderly Patients with Gastric Adenocarcinoma After Gastrectomy
Figure 1 The flow diagram of the selection process for elderly patients with gastric adenocarcinoma undergoing radical gastrectomy.
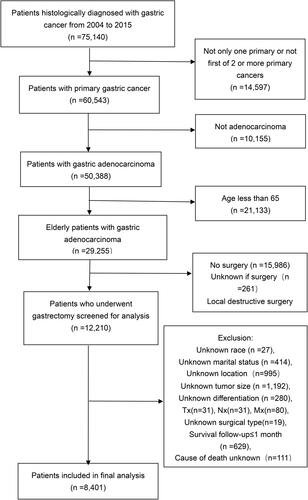
Figure 2 OS and GCSS curves of all elderly patients with gastric adenocarcinoma undergoing radical gastrectomy.
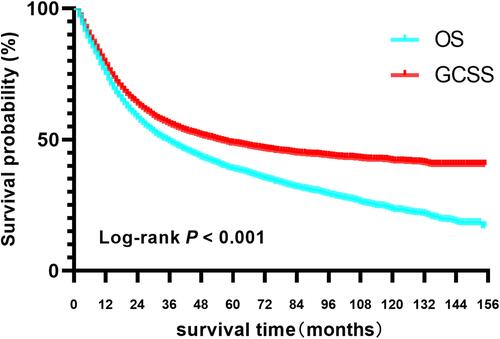
Table 2 Univariate and Multivariate Cox Regression Analyses Estimating the Risk Factors for OS of Elderly Patients with Gastric Adenocarcinoma After Gastrectomy
Table 3 Univariate and Multivariate Cox Regression Analyses Estimating the Risk Factors for GCSS of Elderly Patients with Gastric Adenocarcinoma After Gastrectomy
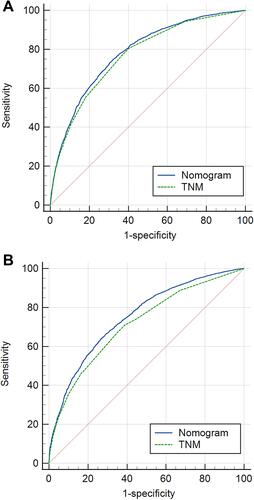
Table 4 Comparison of AUC Between the Nomogram and TNM Stage
Figure 3 (A) Nomogram for predicting the 3-year and 5-year OS rates of elderly patients undergoing radical gastrectomy. (B) Nomogram for predicting the 3-year and 5-year GCSS rates of elderly patients undergoing radical gastrectomy.
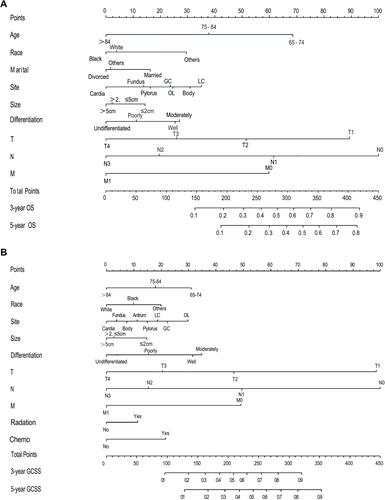
Figure 4 (A) Calibration curve of the nomogram for predicting the 3-year OS rates of elderly patients undergoing radical gastrectomy. (B) Calibration curve of the nomogram for predicting the 5-year OS rates of elderly patients undergoing radical gastrectomy.
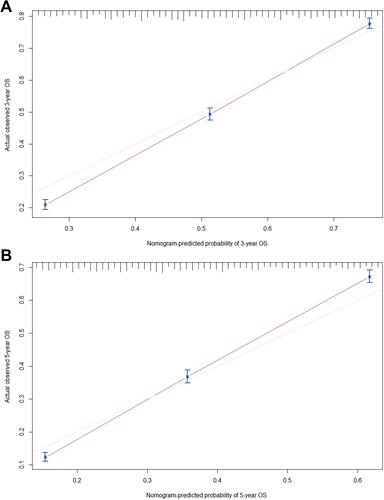
Figure 5 (A) Calibration curve of the nomogram for predicting the 3-year GCSS rates of elderly patients undergoing radical gastrectomy. (B) Calibration curve of the nomogram for predicting the 5-year GCSS rates of elderly patients undergoing radical gastrectomy.
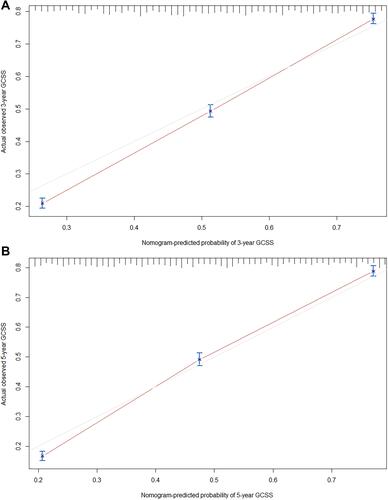
Figure 6 Decision curve analysis (DCA) curves of the two nomograms for elderly patients undergoing radical gastrectomy. (A) DCA for overall OS; (B) DCA for GCSS.
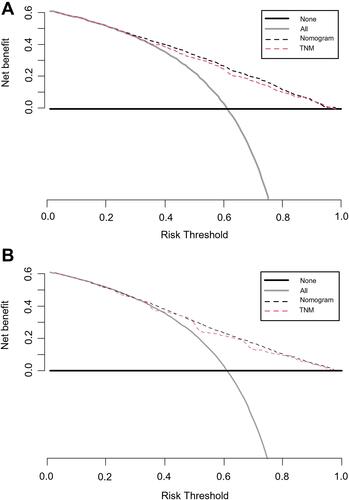
Figure 7 Receiver operating characteristic (ROC) curves of the two nomograms for elderly patients undergoing radical gastrectomy. (A) ROC curve for OS; (B) ROC curve for GCSS.