Figures & data
Figure 1 Flowchart of 16-genes signature model construction.
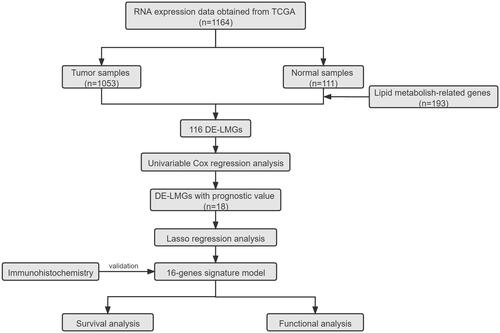
Figure 2 Identification of candidate genes related to lipid metabolism in breast cancer. (A) Venn diagram illustrating prognostic DEGs between tumor and normal samples. (B) Heatmap analysis of 18 prognostic DEGs, red indicates upregulated genes and blue indicates downregulated genes. (C) Forest plot with hazard ratios from the survival analysis based on the univariate Cox regression model using gene expression levels as variables. (D) Construction and visualization of a protein–protein interaction (PPI) network of 18 genes generated using the STRING database. Yellow lines represent text-mining evidence in the PPI network, and black lines represent co-expressed proteins. (E) Network analysis of internal correlations among 18 candidate genes. Correlation coefficients are indicated by different colors. Red line: positive correlation; Blue line: negative correlation. The deeper the colours, the stronger the relevance. (F) Alteration of the 18 candidate genes in clinical samples.
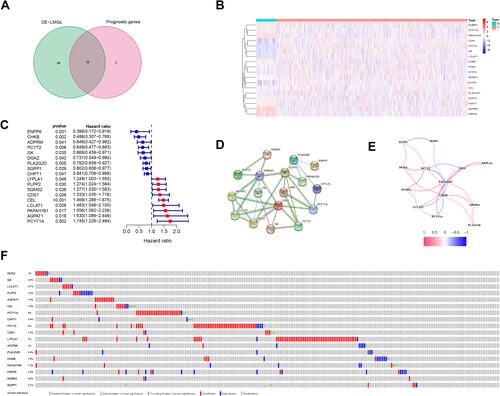
Figure 3 Synthetic analysis of a prognostic gene signature. (A) LASSO coefficient profiles of the 18 genes in BC samples. (B) Selection of the optimal parameter (lambda) in the LASSO model for BC. (C) The distribution and median value of the risk scores among BC samples. (D) Score plot for the principal component analysis (PCA). (E) OS status, OS, and risk score in the TCGA cohort. (F) OS by Kaplan–Meier curves for patients in the two risk groups. (G) AUC of time-dependent ROC curves verified the prognostic performance of the risk score.
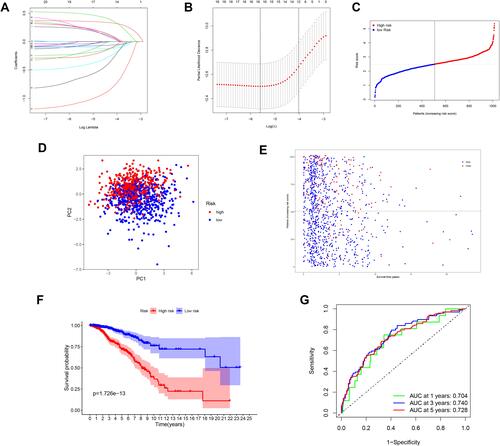
Table 1 Univariable and Multivariable Analyses for Each Clinical Feature
Figure 4 Independent prognostic analysis of risk scores and clinical parameters. (A) The univariate Cox regression analysis of the associations between the risk scores and clinical parameters and the OS of patients. (B) The multivariate Cox regression analysis of the associations between the risk scores and clinical parameters and the OS of patients.
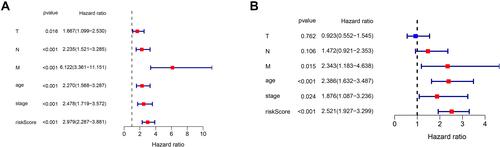
Figure 5 Functional enrichment analyses and ssGSEA enrichment scores in the TCGA cohort. (A) GO analysis showing the biological processes, cellular components and molecular functions enrichment of DEGs in two groups. (B) KEGG analysis of DEGs in two groups. (C) The distribution of ssGSEA enrichment scores of 16 immune cells between high-risk and low-risk groups in BC samples. (D) The distribution of ssGSEA enrichment scores of 13 immune-related biological processes between high-risk and low-risk groups in BC samples. (E) P values were showed as: ns not significant; *P < 0.05;**P< 0.01; ***P < 0.001. Expression levels of genes PD-L1 among two risk subgroups in BC patients (F) and PD-L2. (G) Correlation analysis between risk score, PD-L1 (H) and PD-L2.
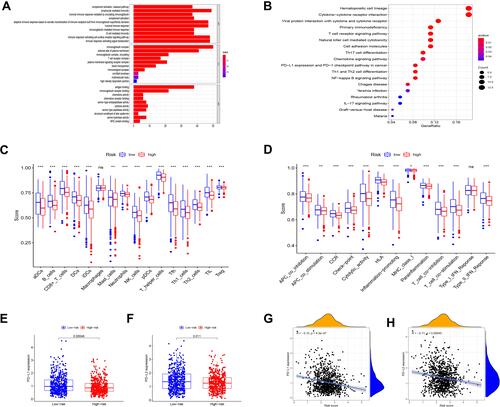
Figure 6 The mRNA expression level of 16 LMGs in TCGA. (A) ADPRM expression (B) AGPAT1 expression (C) CEL expression (D) DGKZ expression (E) ENPP6 expression (F) CHKB expression (G) GK expression (H) PCYT1A expression (I) PAFAH1B1 expression (J) PCYT2 expression (K) PLA2G2D expression (L) SGMS2 expression (M) CHPT1 expression (N) SGPP1 expression (O) LYPLA1 expression (P) PLPP2 expression.
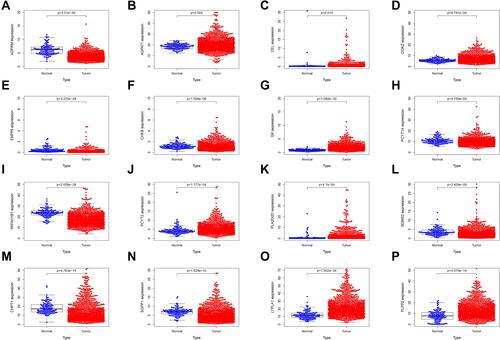
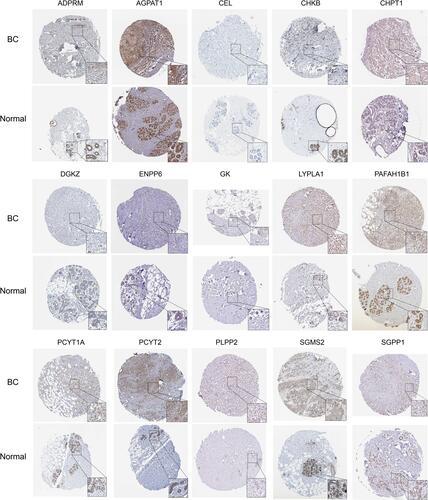
Figure 7 Representative immunohistochemistry of 15 LMGs between breast cancer and normal tissues in the Human Protein Atlas database.