Figures & data
Table 1 Demographic Characteristics, Clinical Manifestations, Lab Findings and Disease Activity of SLE Patients
Figure 1 Gel electrophoresis of PCR products demonstrating different HLA-G genotypes of the studied participants. Lane L: 100-bp DNA Ladder; lanes 2, 3, 4, 6, 11, 12, 14, 15, 16: HLA-G homozygotes ins/ins (+14bp/+14bp); lanes 9,10: HLA-G heterozygotes ins/del (+14bp/-14bp); lanes 1, 5, 7, 8,13: HLA-G homozygotes del/del (−14bp/-14bp). Depending upon the insertion or deletion of 14 bp sequence in HLA‐G exon 8, PCR products of length 224 or 210 bp were generated, respectively. Three different genotypes homozygous for 14 bp insertion [ins/ins] (+/+14 bp) 224 bp, homozygous for 14 bp deletion [del/del] (−/−14 bp) 210 bp and heterozygous for 14 bp insertion/deletion [ins/del] (+/−14 bp) 224 bp and 210 bp were generated.
![Figure 1 Gel electrophoresis of PCR products demonstrating different HLA-G genotypes of the studied participants. Lane L: 100-bp DNA Ladder; lanes 2, 3, 4, 6, 11, 12, 14, 15, 16: HLA-G homozygotes ins/ins (+14bp/+14bp); lanes 9,10: HLA-G heterozygotes ins/del (+14bp/-14bp); lanes 1, 5, 7, 8,13: HLA-G homozygotes del/del (−14bp/-14bp). Depending upon the insertion or deletion of 14 bp sequence in HLA‐G exon 8, PCR products of length 224 or 210 bp were generated, respectively. Three different genotypes homozygous for 14 bp insertion [ins/ins] (+/+14 bp) 224 bp, homozygous for 14 bp deletion [del/del] (−/−14 bp) 210 bp and heterozygous for 14 bp insertion/deletion [ins/del] (+/−14 bp) 224 bp and 210 bp were generated.](/cms/asset/d7932940-641e-4a2b-b890-d366e572d22b/dijg_a_12168855_f0001_c.jpg)
Table 2 Genotypes and Allele Frequency of HLA-G Among the Studied Groups
Table 3 Relation Between Genotype Frequency of HLA-G and Clinical Manifestations, Laboratory Findings and Disease Activity Among SLE Patients
Figure 2 TLR9 serum level (ng/L) among the studied groups. A box plot diagram demonstrating a significant difference** (P < 0.001) between the mean serum level of TLR9 in SLE patients (n = 102, mean 397.04 ng/L) and that of controls (n = 102, mean 195.22 ng/L).
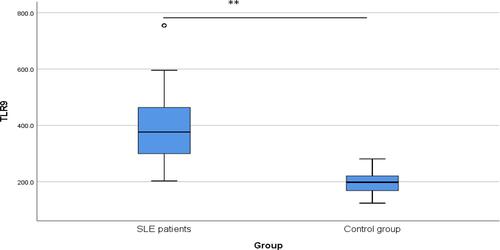
Table 4 Relation Between TLR9 Level (ng/L) and Clinical Features, Laboratory Findings and Disease Activity in SLE Patients
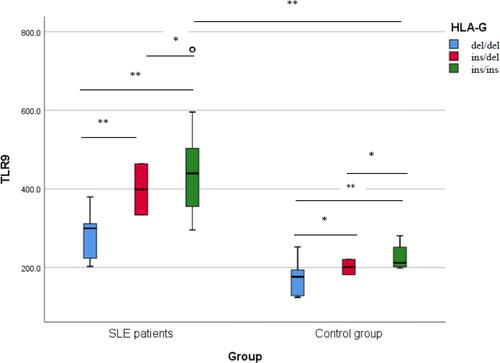
Figure 3 TLR9 level (ng/L) among different HLA-G genotypes in the studied participants. Comparing TLR9 levels among different HLA-G genotypes using Tukey post hoc test demonstrates a significant increase (P < 0.001) in individuals with ins/ins genotype compared to other genotypes whether in SLE patients (n = 102) or control group (n = 102). *Significant, **Highly significant.