Figures & data
Figure 1 (A) The components of m6A RNA methylation regulators in writer-, reader-, and eraser-complex; (B) network of m6A-related lncRNAs and m6A-related genes; (C) forest plot of 39 m6A-related prognostic lncRNAs; (D) the expression levels of 39 prognostic m6A-related lncRNAs in renal cell carcinoma tissue and normal tissue.
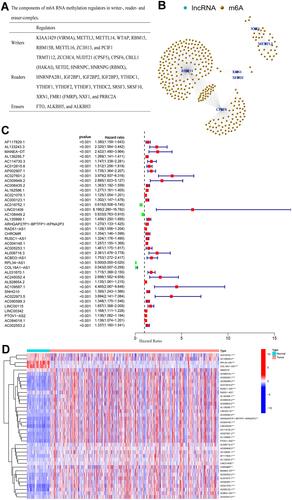
Figure 2 (A) Consensus CDF for k = 2 to 9; (B) area under CDF curve increment for k = 2 to 9; (C) tracking plot for k = 2 to 9; (D) consensus matrix for optimal k = 2; (E) Kaplan–Meier overall survival curves for patients in distinct clusters (p < 0.001); (F) PD-L1 expression levels in distinct clusters (** p < 0.01); (G) immunescore for each patient in distinct clusters (p = 0.31); (H) various types of immune cells in distinct clusters; (I) Correlation matrix of PD-L1 and 39 prognostic m6A-related lncRNAs; (J–M) gene set enrichment analysis indicating that tumor signal pathways were enriched in the cluster 2 subgroup.
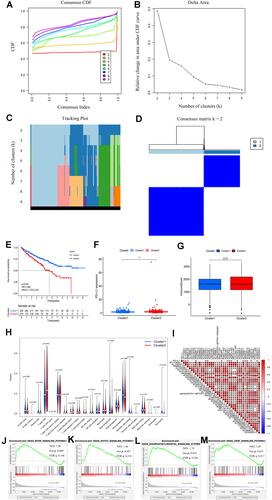
Figure 3 (A–B) Least absolute shrinkage and selection operator (LASSO) regression, calculating the minimum criteria; (C) coefficients of selected lncRNAs; (D) Kaplan–Meier curves showed that the high-risk subgroup had worse overall survival than the low-risk subgroup in the training set; (E) distributions of risk scores and survival status of renal cell carcinoma patients in the training set; (F) receiver operating characteristic (ROC) curves of m6A-related lncRNAs significance for predicting the overall survival in the training set; (G) Kaplan–Meier curves showed that the high-risk subgroup had worse overall survival than the low-risk subgroup in the test set; (H) distributions of risk scores and survival status of renal cell carcinoma patients in the test set; (I) receiver operating characteristic (ROC) curves of m6A-related lncRNAs significance for predicting the overall survival in the test set; (J) heatmap of the expression of m6A-related lncRNAs in the high- and low-risk subgroups of the training set; (K) heatmap of the expression of m6A-related lncRNAs in the high- and low-risk subgroups of the test set; (L) correlation matrix of PD-L1 and 7 critical prognostic m6A-related lncRNAs; (M) correlation matrix of PD-1 and 7 critical prognostic m6A-related lncRNAs; (N) correlation matrix of CTLA4 and 7 critical prognostic m6A-related lncRNAs; (O) correlation matrix of LAG3 and 7 critical prognostic m6A-related lncRNAs; (P–V) the expression levels of AC108449.2, AF117829.1, AL008718.3, AL031670.1, CHROMR, COL18A1−AS1, and LINC00342 were significantly correlated with the prognosis of patients with ccRCC (all p values <0.01).
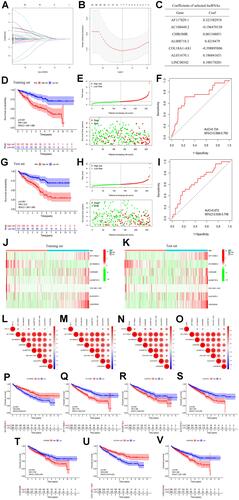
Figure 4 (A) Heatmap of the associations between the expression levels of the 7 critical m6A-related lncRNAs and clinicopathological features in the entire cohort; (B–I) risk scores of renal cell carcinoma patients with different clinicopathological features (including age, gender, grade, cluster, T stage, N stage, M stage, clinical stage); (J–U) Kaplan–Meier survival stratification analyses in multiple subgroups of renal cell carcinoma patients (including patients aged ≤65 or >65 years, male or female patients, patients with G1-2 or G3-4 tumors, patients with T1-2 or T3-4 tumors, patients with N0 or N1 diseases, patients with M0 or M1 diseases); (V) various types of immune cells in the low- and high-risk subgroups.
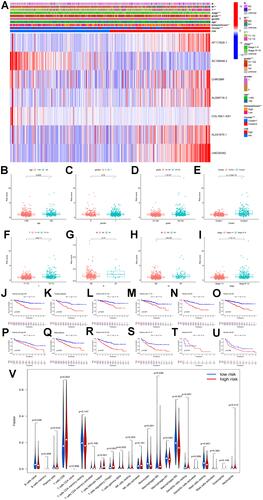
Figure 5 (A and B) Univariate and multivariate Cox analyses of risk score along with clinicopathological features (including age, gender, grade, and stage) in the training set; (C and D) univariate and multivariate Cox analyses of risk score along with clinicopathological features (including age, gender, grade, and stage) in the test set; (E) nomogram based on risk score, age, grade, and stage in the entire cohort; (F–H) calibration plots of the nomogram for predicting the probability of overall survival at 1, 2, and 3 years in the TCGA dataset; (I–L) the expression levels of PD-L1, PD-1, CTLA4, and LAG3 in the high- and low-risk subgroup.
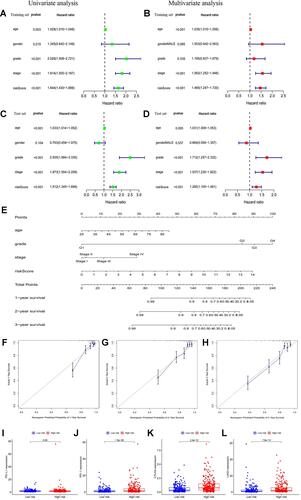
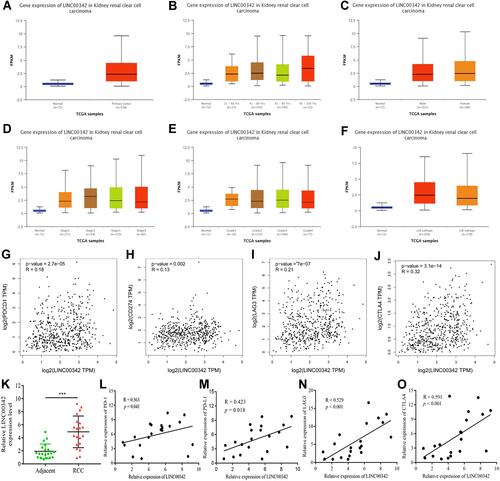
Figure 6 (A) The relative expressions of LINC00342 in normal individuals and renal cell carcinoma (RCC) patients (UALCAN); (B) the relative expressions of LINC00342 in normal individuals or in RCC patients with different ages (UALCAN); (C) the relative expressions of LINC00342 in normal individuals of either gender and in male or female RCC patients (UALCAN); (D) the relative expressions of LINC00342 in normal individuals or in RCC patients in stage 1, 2, 3, or 4 (UALCAN); (E) the relative expressions of LINC00342 in normal individuals or in RCC patients with Grade 1, Grade 2, Grade 3, and Grade 4 diseases (UALCAN); (F) the relative expressions of LINC00342 in normal individuals or in RCC patients with different tumor subtypes (UALCAN); (G–J) PD-1, PD-L1, LAG3, and CTLA4 genes positively correlated with LINC00342 in RCC patients (GEPIA); (K) the relative expressions of LINC00342 in 20 RCC tissues and paired adjacent normal tissues of our own cohort using qRT-PCR; (L–O) PD-1, PD-L1, LAG3, and CTLA4 genes positively correlated with LINC00342 in 20 RCC tissues and paired adjacent normal tissues of our own cohort using qRT-PCR.