Figures & data
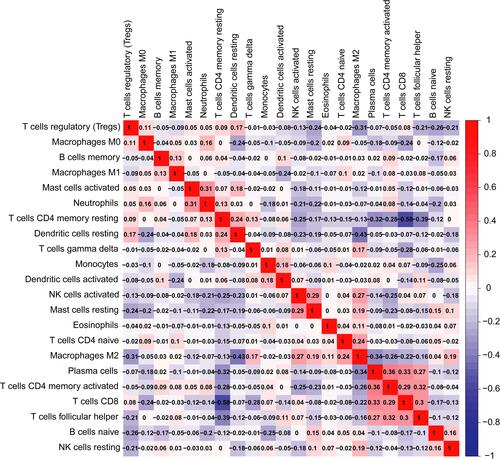
Figure 1 HMGA1 mRNA expression levels in normal and HCC tissues, as obtained from the (A) TCGA, (B) ICGC, (C) GEO, and (D) Guangxi cohort. Representative immunohistochemical staining images of HMGA1 protein in HCC specimens (E and F) and in normal liver tissues (G and H), which taken from the open HPA dataset.
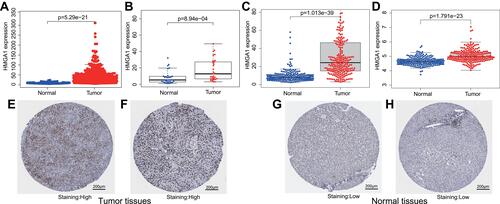
Table 1 Association Between Clinicopathological Features of Patients and HMGA1 Expression in the Cancer Genome Atlas
Table 2 Association Between HMGA1 Expression and Clinicopathological Features (Logistic Regression)
Table 3 Univariate Cox Proportional Hazards Regression and Multivariate Cox Regression Analyses of HMGA1 and Clinical Features in HCC
Figure 2 Kaplan-Meier analysis of HMGA1 and OS time of HCC in the (A) TCGA, (B) ICGC, (C) GEO, and (D) Guangxi cohorts.
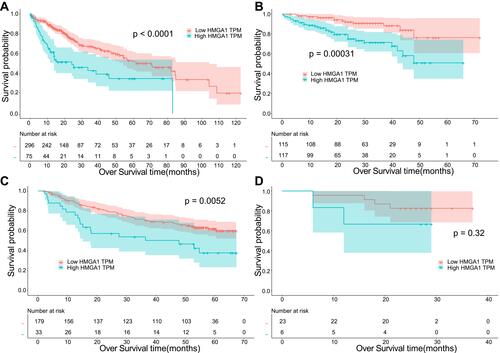
Figure 3 Boxplot showing expression of HMGA1 correlate with different histological grades (A), T stages (B), pathologic stages (C), and p53 gene mutation status (D) in HCC. The t-test was used to estimate the significance of the difference in gene expression levels between groups. The application value of HMGA1 in HCC clinical parameters. (E) Forest plot illustrated the results of multivariate Cox regression analyses. ***Stands for P < 0.001. (F) ROC curves of pathologic stage, T stage, M stage, and HMGA1 expression.
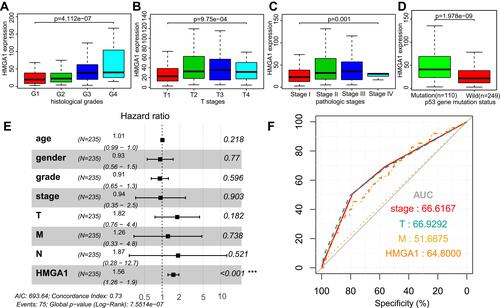
Figure 4 Significantly enriched GO annotations (A) and KEGG pathways (B) of HMGA1 in HCC based on TCGA database. (C) PPI analysis of HMGA1 by STRING. (D) HMGA1 co-expression network was inferred from Coexpedia and deep hue indicated a higher degree of association with HMGA1.
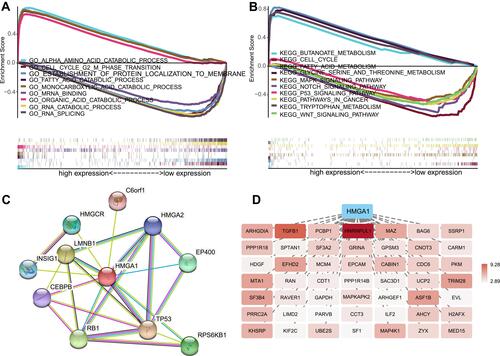
Figure 5 HMGA1 mRNA expression was respectively significant positive correlation to the mRNA expressions of TP53 (R=0.4, P<0.001), RB1 (R=0.17, P<0.001), CCNB1 (R=0.54, P<0.001), PAK1 (R=0.42, P<0.001), CDK1 (R=0.37, P<0.001), CDK2 (R=0.34, P<0.001), CDK4 (R=0.55, P<0.001), E2F1 (R=0.22, P<0.001), E2F2 (R=0.39, P<0.001), HNRNPUL1 (R=0.45, P<0.001), while was significant negative correlation to GADD45A (R=−0.23, P<0.001) (A–L).
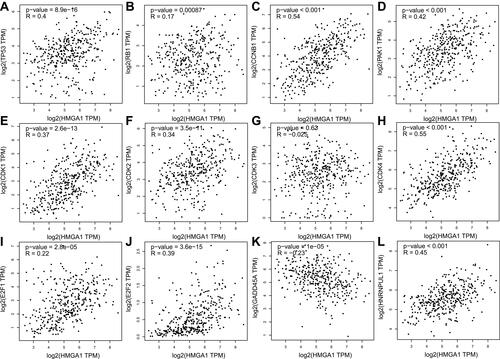
Figure 6 The relationship between HMGA1 and immune invasion in hepatocellular carcinoma. (A) Relationship between the abundance of immune cells and HMGA1 expression in HCC (TIMER). (B) Different proportions of sorts of immune cells in high- and low-HMGA1 groups in HCC specimens (CIBERSORT).
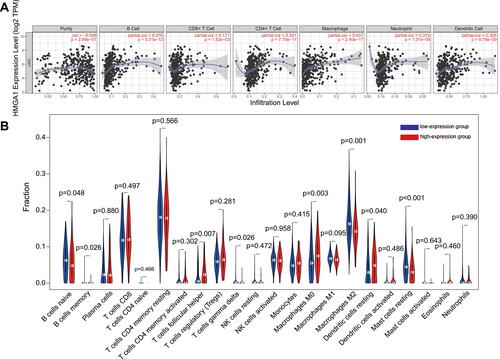
Figure 7 Resulting heat map visualizing the correlation matrix of diverse tumor-infiltrating immune cells subpopulations. Each tile indicates coefficients calculated by Pearson’s correlation test.