Figures & data
Table 1 List of Subtypes of Thyroid Carcinoma and the Current Treatment Provided
Table 2 List of Gene Sets Included in the Study
Table 3 Patient Characteristics for the Six Biopsies Collected from Thyroid Cancer Patients in UAE
Figure 1 Flow chart of transcriptomics data normalisation and gene set enrichment analysis
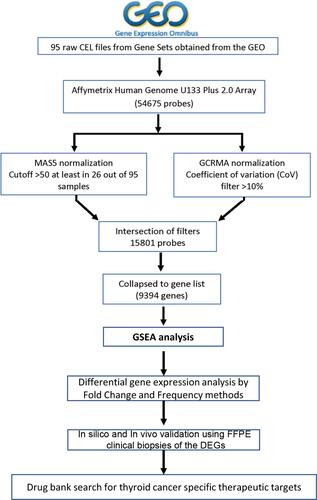
Table 4 List of Number of Significant Pathways Enriched in Non-Aggressive and Metastatic PTC Compared to Normal Thyroid Tissue in Absolute GSEA
Table 5 List of the Pathways Activated in Non-Aggressive Samples in Comparison to Normal Thyroid Tissue Analyzed by GSEA
Table 6 List of the Pathways Activated in Metastatic Samples in Comparison to Normal Thyroid Tissue Analyzed by GSEA
Figure 2 Representation of heatmaps and graphs for GSEA for significant pathways with enrichment scores. (A) The result file for normal and non-aggressive dataset is presented here with graph for enrichment score. (B) Graphical representation for the GSEA for normal versus metastatic data
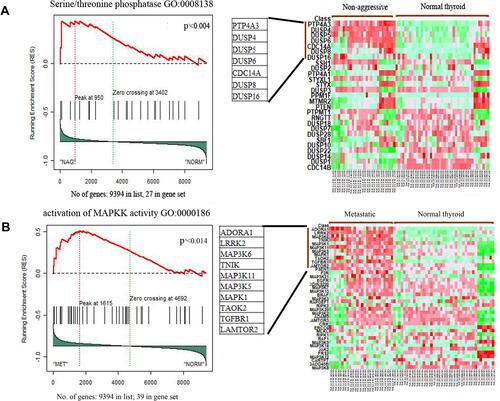
Table 7 List of the Top 40 Genes Based on Frequency in Normal versus NAG Set
Table 8 List of the Top 40 Genes Based on Frequency in Normal versus MET Set
Table 9 List of the 114 Genes Commonly Upregulated in Both the Types of PTC
Figure 3 Intersection of DEGs among non-aggressive and metastatic set compared to normal samples
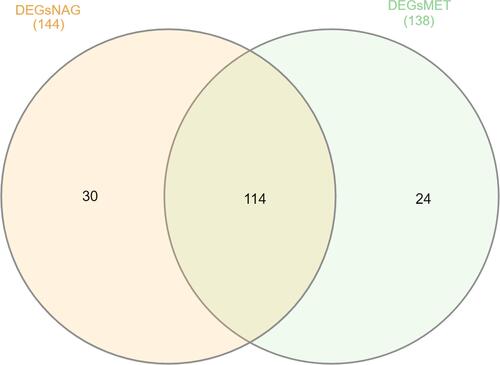
Figure 4 Box plots for log fold expression from microarray data for the three differentially expressed genes identified from in silico analysis between healthy, non-aggressive and metastatic groups. (A) differential expression of EGFR, (B) differential expression of PTK2B and (C) differential expression of KCNN4. *p < 0.05, ***p < 0.01
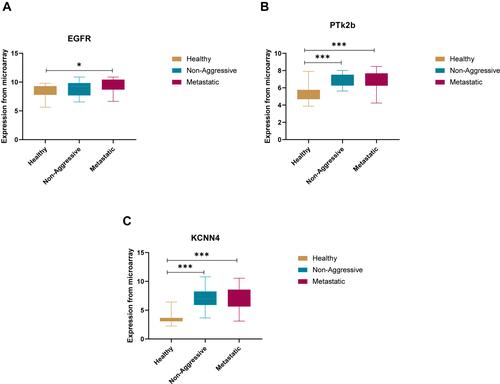
Figure 5 Metascape analysis for the high frequent genes from (A) normal versus non-aggressive set and (B) normal versus metastatic set
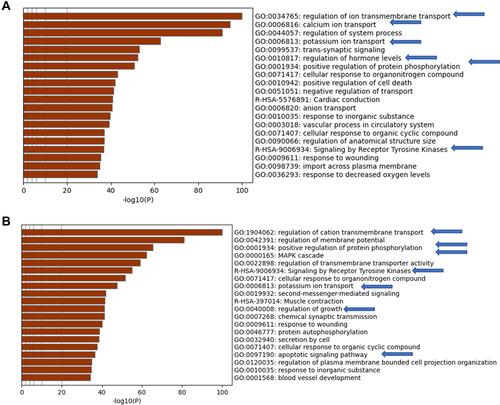
Figure 6 Metascape for DEGs commonly upregulated in both non-aggressive and metastatic PTC
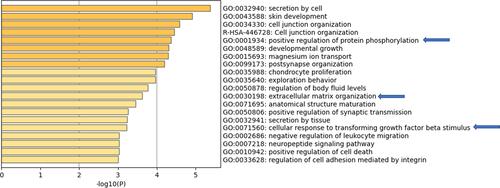
Figure 7 Immune cells enriched in non-aggressive and metastatic PTC in comparison to normal thyroid tissue
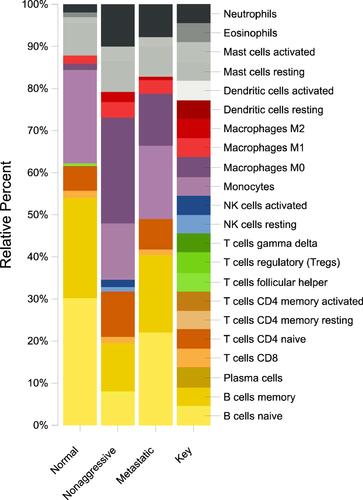
Figure 8 Pathway analysis using Metascape on Ukrainian thyroid cancer samples
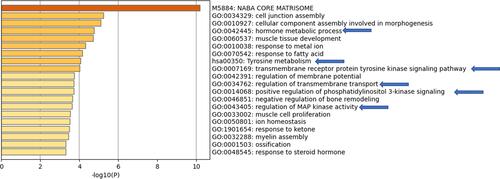
Figure 9 Pathway analysis using Metascape on Brazilian thyroid cancer samples
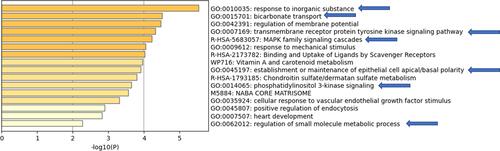
Figure 10 Pathway analysis using Metascape on South Korean thyroid cancer samples
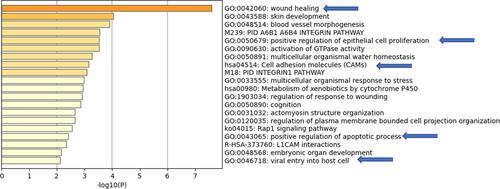
Table 10 List of Drugs Approved by FDA to Treat Thyroid Cancer
Table 11 List of Drugs Related to Other Genes Possibly Involved in Thyroid Cancer
Table 12 List of Drugs Targeting the Genes Highly Upregulated in Population Specific Set
Figure 11 Differential gene expression in six tissue biopsies from thyroid cancer patients from UAE. *p < 0.05, ***p < 0.01
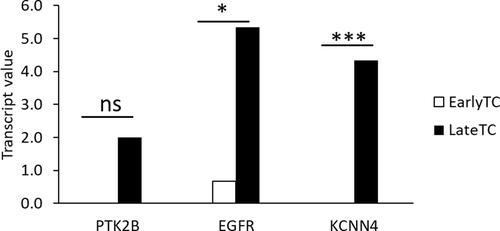
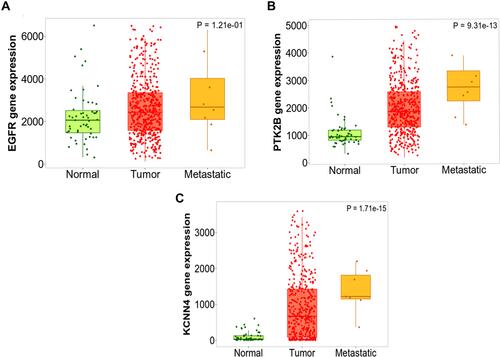
Figure 12 TNM Plot output of the three differentially expressed genes identified from in silico analysis on large independent cohort of 58 normal and 502 non-aggressive and 8 metastatic thyroid cancer cases. (A) differential expression of EGFR, (B) differential expression of PTK2B and (C) differential expression of KCNN4