Figures & data
Table 1 Details of Clinical Samples from GSE23959
Figure 1 The identification of DEGs between the HLHS patients and normal controls. The box plot of gene expression data after normalization (A). The volcano plot of genes detected in HLHS in which the red dots represented the up-regulated genes and the blue dots represented the down-regulated genes (B). The heatmap of DEGs (adjusted p-value<0.05 and |log2(FC)|≥1.00) in which the up-regulated genes were in red color and the down-regulated genes were in blue color (C).
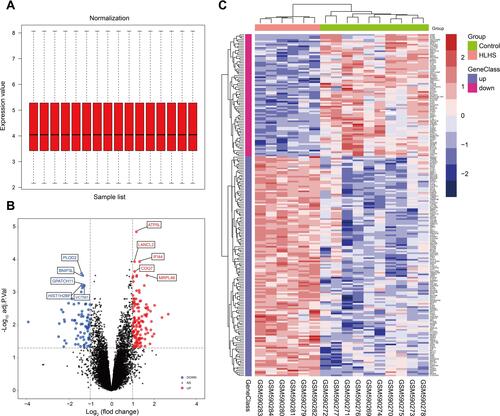
Figure 2 The GO and KEGG pathway enrichment analysis of DEGs. The top ten biological process (A), cellular component (B), molecular function (C) and KEGG pathway (D) of DEGs.
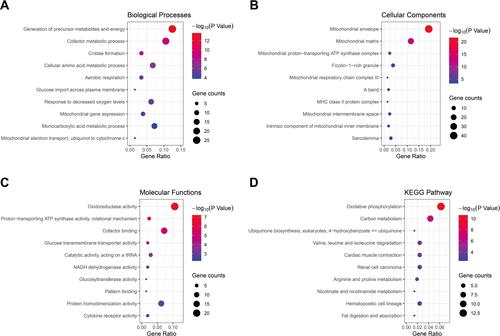
Figure 3 The PPI network of DEGs constructed using the Cytoscape, including 155 nodes and 363 edges. The up-regulated genes were depicted as the circles and the down-regulated genes as the squares. The red and large node showed a high degree, and the yellow and small node showed a low degree.
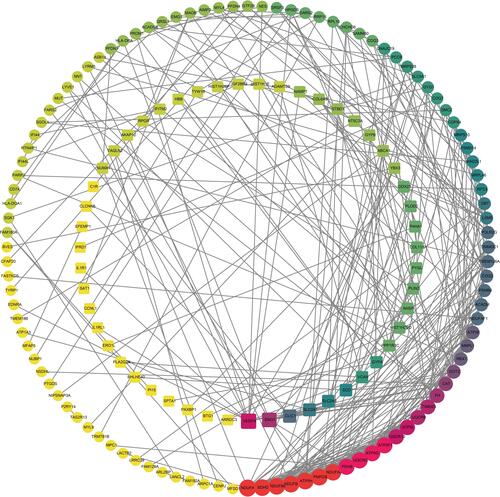
Figure 4 The network analysis of DEGs. The clustered module 1 identified from the whole PPI network (A). The enrichment analysis of the module 1 by the Metascape (C). The clustered module 2 identified from the whole PPI network (B). The enrichment analysis of the module 2 by the Metascape (D). The Venn diagram showing the number of overlapping genes among the three topological analysis methods (E). The interactions among the fifteen hub genes (F). The enrichment analysis of the hub genes by the Metascape (G).
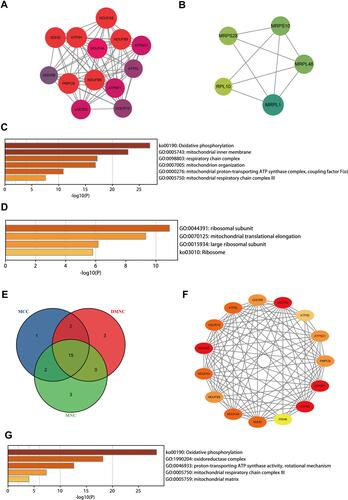
Table 2 Hub Genes Identified Through Three Topological Analysis Methods
Figure 5 TF-target DEGs regulatory network. The green and red nodes for the DEGs, and the blue diamonds for the TFs.
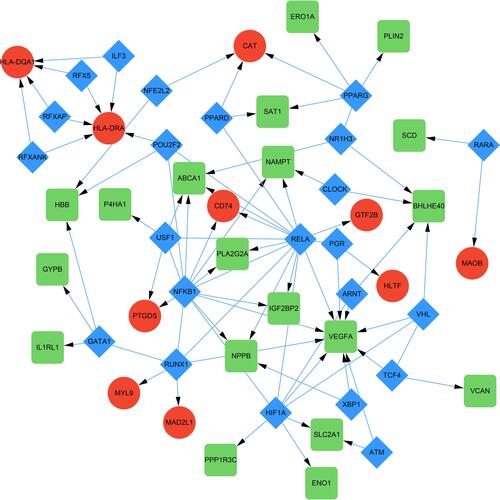
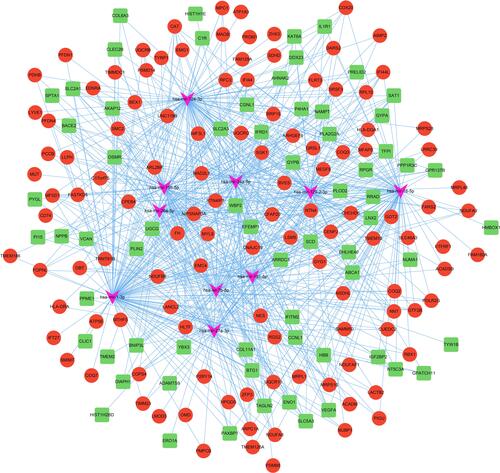
Figure 6 MicroRNA-target DEGs regulatory network. The green and red nodes for the DEGs, and the pink V-shapes for the miRNAs.