Figures & data
Figure 1 U81 and SNORA7B as a prognostic signature in breast cancer. (A) Differentially expressed snoRNAs between breast cancer and control samples shown in the volcano plot. (B) Differentially expressed snoRNAs between breast cancer and control samples shown in the heatmap. (C) Univariate cox regression analysis identified six snoRNA associated with prognosis of BC. (D) Multivariate cox regression analysis identified U81 and SNORA7B as a robust prognostic signature in BC. (E) Kaplan–Meier survival curves for U81 (E) and SNORA7B (F).
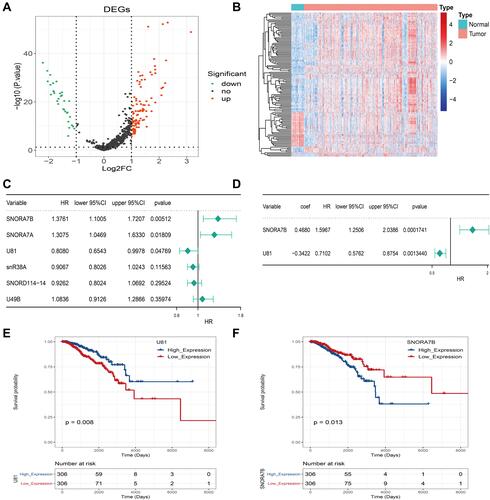
Figure 2 Relationship between U81 and different clinical characteristics. The expression of U81 was significantly different between age≥ 50 and age< 50, while there was no difference in other clinical features including gender, T, N, M and pathologic stage. *P < 0.05.
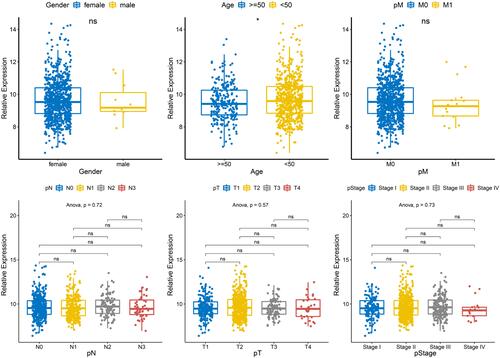
Figure 3 Relationship between SNORA7B and different clinical characteristics. The expression of SNORA7B was significantly different between groups divided by age, N stage and T stage, while there was no difference in other clinical features including gender, M and pathologic stage. *P < 0.05, **P < 0.01, ***P < 0.001.
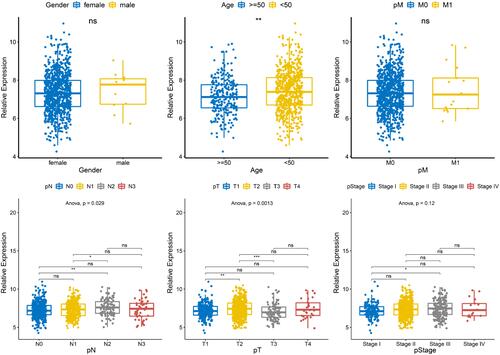
Table 1 Relationship Between Risk Score and Clinical Characteristics
Figure 4 The prognostic value of the risk score signature in training and testing cohorts. (A–D) Risk curve, gene expression profile, KM survival and time-dependent ROC curves of OS based on U81 and SNORA7B in training cohort. (E–H) Risk curve, gene expression profile, K-M survival and time-dependent ROC curves of OS based on U81 and SNORA7B in the testing cohort.
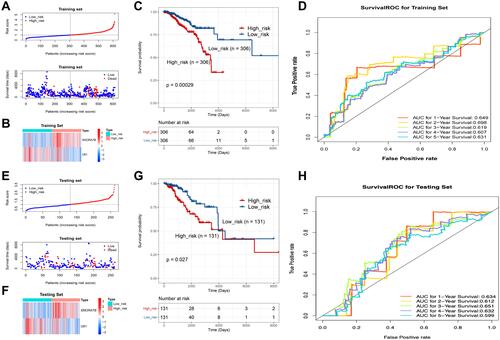
Figure 5 The risk score signature is an independent prognostic factor in BC. (A and B) Forest plots of the univariate (A) and multivariable (B) cox regression analysis identified independent prognostic factors in BC. The p value, HR and 95% confidence interval (CI) were indicated in the figure. (C) Nomograms for predicting the 1-, 2-, 3-, 4-, and 5-years survival of BC patients based on independent prognostic factors. (D) Calibration curves of the nomogram for predicting the 1-, 2-, 3-, 4-, and 5-year survival.
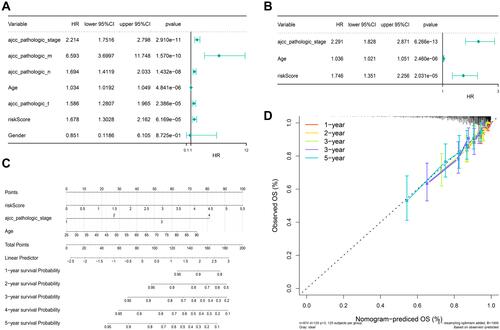
Figure 6 Immune characterization of high- and low-risk groups. (A) Immune infiltration of high- and low-risk groups by ssGSEA. (B–D) IPS score (B), TIDE score (C), and immunotherapeutic responders (D) of the high- and low-risk groups. The high-risk group had higher IPS-PD-1, IPS-PD-L1, and IPS-CTLA-4 scores, lower TIDE scores, and more responders. *P < 0.05, **P < 0.01, ***P < 0.001.
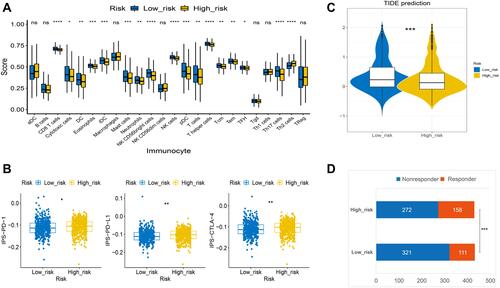
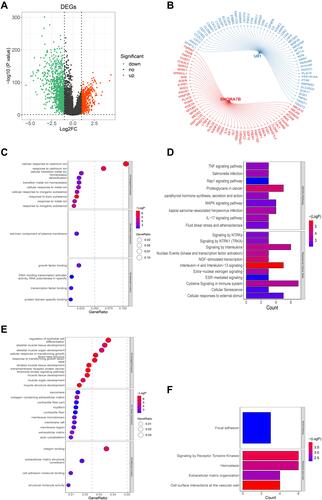
Figure 7 Construction of snoRNA-related gene-drug interaction network. (A) Differentially expressed mRNAs between control and BC samples. (B) he top 50 genes correlated with U81 or SNORA7B. (C and D) GO (C) and KEGG pathway (D) enrichment analyses of the top 50 U81-correlated genes. These genes were mainly enriched in ion channel-related biological functions and immune-related signaling pathways. (E and F) GO (E) and KEGG pathway (F) enrichment analyses of the top 50 SNORA7B-correlated genes. These genes were primarily enriched in muscle development-related biological processes and ECM-related pathways.