Figures & data
Figure 1 PPP1R3B was overexpressed in STAD tissues.
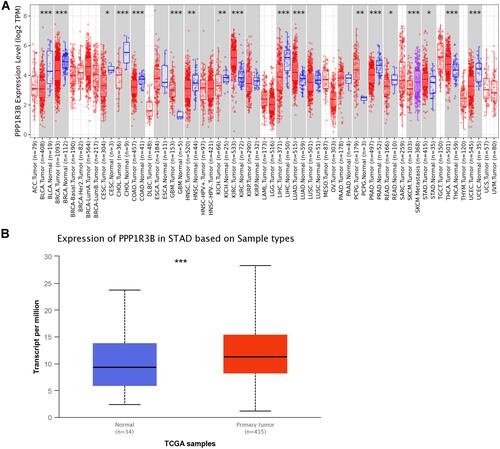
Figure 2 PPP1R3B expression in STAD tissues. (A–F) Expression of PPP1R3B in STAD in terms of clinical variables. (G-I) Images of immunohistochemical staining showing PPP1R3B protein expression in STAD from The Human Protein Atlas. ***P < 0.001.
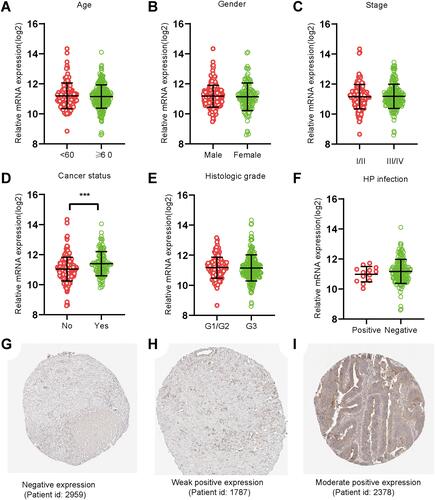
Table 1 Correlation Between OS and Clinicopathologic Features of GC Patients
Table 2 Multivariate Analyses of the PPP1R3B in the Prediction of Gastric Cancer Overall Survival
Figure 3 Prognostic model of PPP1R3B in patients with STAD.
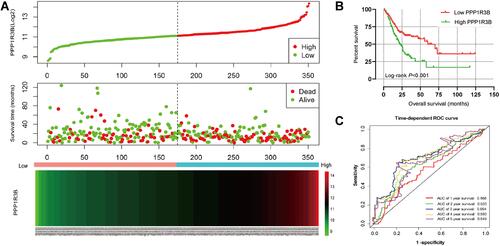
Table 3 Stratified Analysis of PPP1R3B Gene and OS in GC Patients
Table 4 Joint Effects Survival Analysis of Clinical Factors and the PPP1R3B Expression with OS
Table 5 The Prognostic Value of the mRNA Expression of PPP1R3B in Various Clinical Features from KM-Plotter
Figure 4 Joint effects analysis of overall survival stratified by PPP1R3B and STAD clinical parameters.
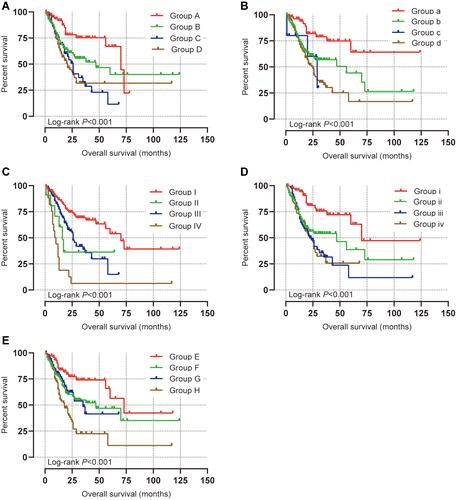
Figure 5 Prognostic value of PPP1R3B (1552670_a_at) expression determined by Kaplan–Meier plotter database.
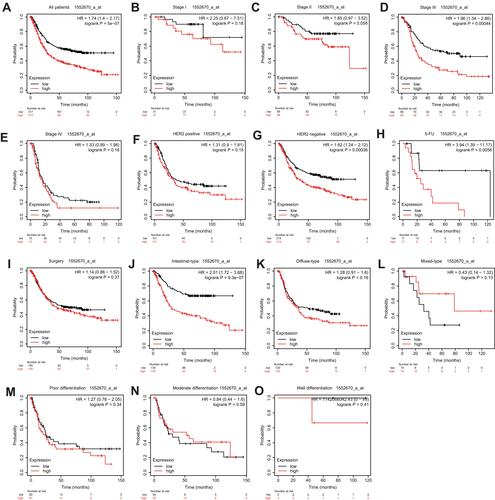
Figure 6 GO and KEGG analysis of genes co-expressed with PPP1R3B.
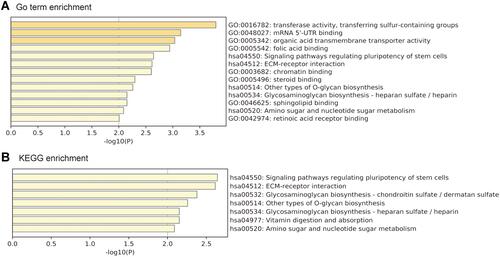
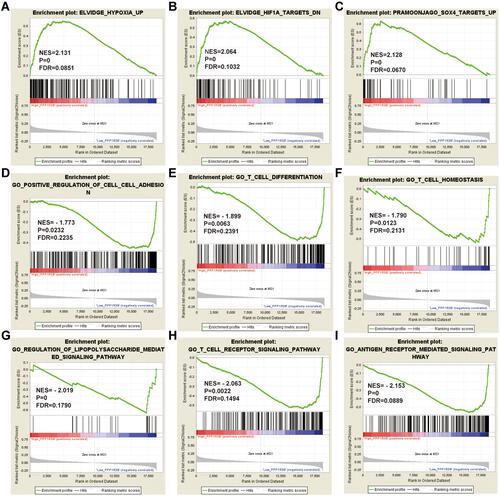
Figure 7 GSEA analysis of PPP1R3B in STAD patients using the TCGA database.