Figures & data
Figure 1 (A) The volcano plot shows the relationship between the fold change and the P value in each group of microarrays. Red is an up-regulated gene, and blue is a down-regulated gene. Adjust P value <0.05. (B) Venn diagram, select DEG fold change> 2, P value <0.01, 3 microarray data sets show that 629 genes overlap. (C) 629DEG’s PPI network.
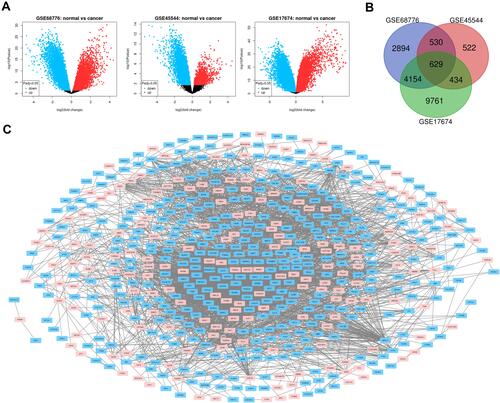
Table 1 Enrichment Analysis (629DEG’s)
Table 2 Enrichment Analysis (10DEG’s)
Figure 2 (A) The important module is obtained from a PPI network with 48 nodes and 782 edges. Red is an up-regulated gene; light blue is a down-regulated gene. (B) Using cytohubba’s MCC algorithm to screen out the top ten genes in the module, we can see the connection between them. The weight of these genes in the module network becomes higher as the color darkens.
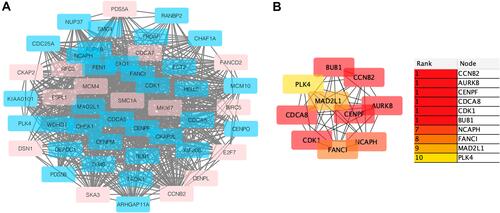
Table 3 Annotation (10DEG’s)
Figure 3 PPI-network and Bioanalysis chart. (A) Co-expression of hub genes. The blue nodes are co-expressed genes, and the red nodes are hub genes. (B) Some biological process diagrams of hub genes. The size of the node refers to the ontology of the gene. The color depth of the node refers to the adjusted P value.
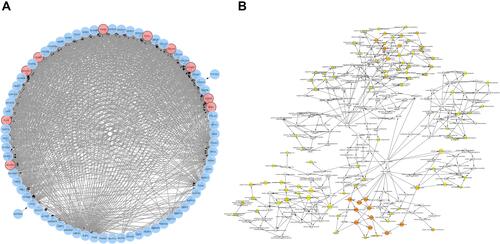
Figure 4 (A) Hierarchical clustering: down-regulated genes are marked in blue, and up-regulated genes are marked in red. Sample type: Different colors in the picture correspond to different sample types. The sarcoma sample data (n=271) comes from the TCGA database. P<0.05 is considered statistically significant. (B) The correlation between gene expression and clinical outcome. (SARC, n=260).
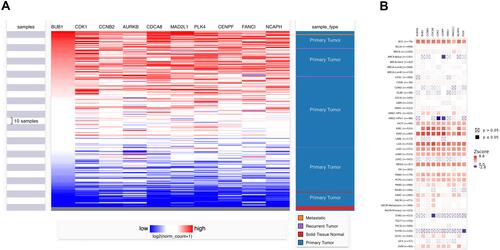
Figure 5 The relationship between gene expression and immune infiltration.
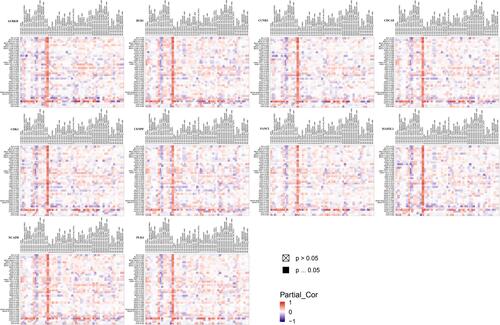
Figure 6 Survival analysis. CDCA8, NACPH, CDK1, MAD2L1, CCNB2 and FANCI have a relatively high overall survival rate (>30%). P<0.05 was considered statistically significant.
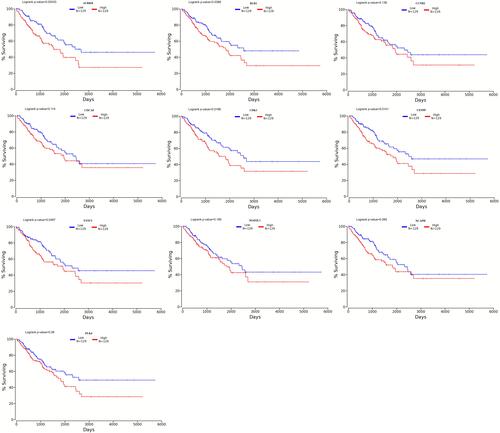
Figure 7 Comparison of genes in multiple analyses. FANCI: Cancer Type: Sarcoma. 1. Neale Multi-cancer. 2. Neale Multi-cancer 2; MAD2L1: Cancer Type: Sarcoma. 1. Barretina CellLine 2. 2. Neale Multi-cancer. 3. Rothenberg CellLine; CDCA8: Cancer Type: Sarcoma. 1. Barretina CellLine 2. 2. Neale Multi-cancer. 3. Neale Multi-cancer 2. 4. Rothenberg CellLine; NCAPH: Sarcoma Type: Ewing’s Sarcoma. 1. Baird Sarcoma. Cancer Type: Sarcoma. 2. Neale Multi-cancer. 3. Neale Multi-cancer 2; AURKB: Cancer Type: Sarcoma. 1. Barretina CellLine 2. 2. Bittner Multi-cancer. 3. Neale Multi-cancer. 4. Wooster CellLine; CCNB2: Sarcoma Type: Ewing’s Sarcoma. 1. Bittner Sarcoma. Cancer Type: Sarcoma. 2. Neale Multi-cancer. 3. Rothenberg CellLine; BUB1: Cancer Type: Sarcoma. 1. Bittner Multi-cancer. Sarcoma Type: Ewing’s Sarcoma. 2. Henderson Sarcoma; CDK1: Sarcoma Type: Ewing’s Sarcoma. 1. Baird Sarcoma. Cancer Type: Sarcoma. 2. Barretina CellLine 2. The rank for a gene is the median rank for that gene across each of the analyses. The p-value for a gene is its p-value for the median-ranked analysis. In the heat map of 8 genes, CDCA8, MAD2L1 and FANCI have more or higher expressions.
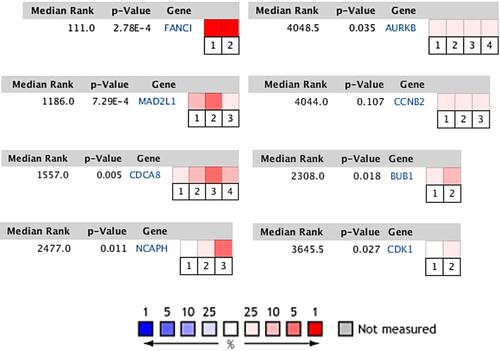
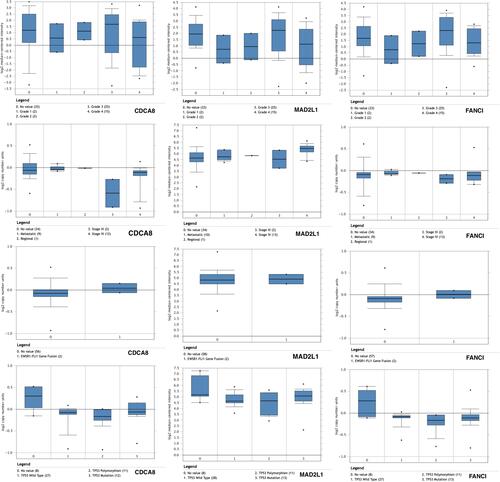
Figure 8 The relationship between the expression of genes (CDCA8, MAD2L1 and FANCI) and clinical Ewing’s sarcoma grade, staging, EWSR1-FLI1 pathway and tp53 mutation pathway. MAD2L1 has higher expression in the four cases, while CDCA8 and FANCI have higher expression in the grades of ES.