Figures & data
Table 1 Municipality Characteristics
Table 2 Descriptive Statistics of the Quantitative Data
Table 3 Total Time Spent on Documentation and Reporting
Figure 1 I-chart of total time spent on documentation per day (in %) in Municipality 1 and Municipality 2.
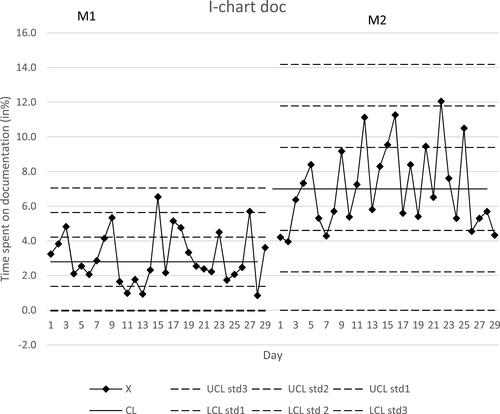
Figure 2 I-chart of total time spent on reporting per day (in %) in Municipality 1 (M1) and Municipality 2 (M2).
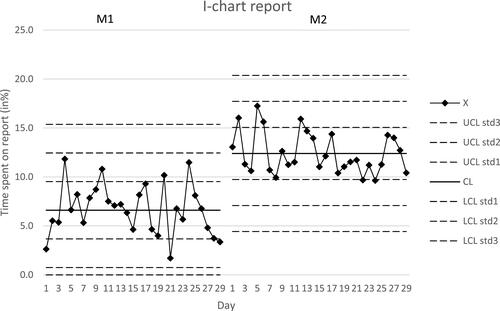
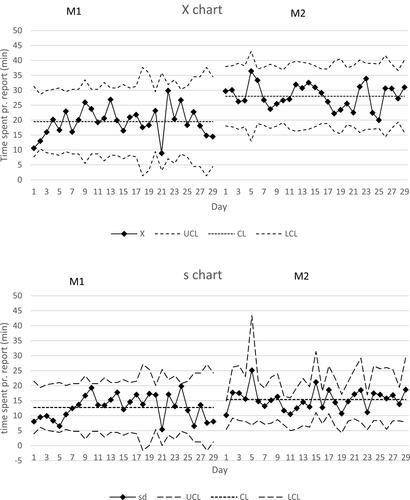
Figure 3 X and s charts for time spent on reporting (in minutes) in Municipality 1 (M1) and Municipality 2 (M2).