
Figures & data
Figure 1 Flow diagram for the selection of patients with anal canal cancer from the SEER database between 2004 and 2015.
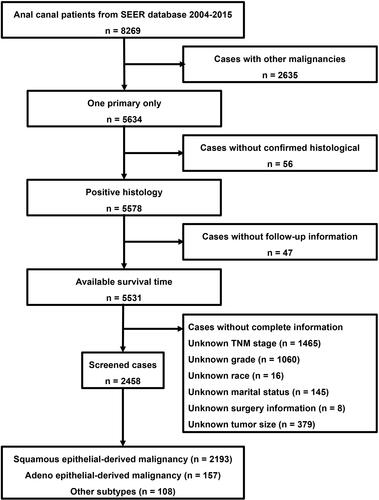
Table 1 Demographic and Clinical Data of the Patients with Anal Canal Cancer
Table 2 ICD-O-3 Code
Table 3 Survival Analyses of Overall Survival for Anal Canal Cancer Patients
Table 4 Survival Analyses of Cancer-Specific Survival for Anal Canal Cancer Patients
Figure 2 Nomogram predicting 1-, 3- and 5-year overall survival (OS) and cancer-specific (CSS) survival rate of patients with anal canal cancer. (A) Nomogram to predict 1-, 3- and 5-year OS for patients with anal canal cancer; (B) Nomogram to predict 1-, 3- and 5-year CSS for patients with anal canal cancer.
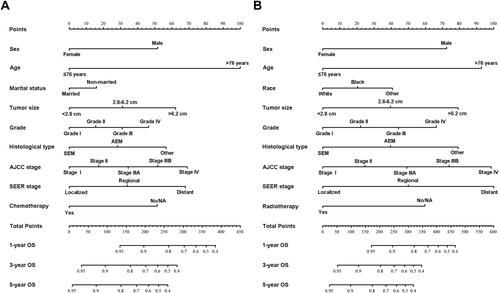
Figure 3 Time-dependent ROC curves. (A) Time-dependent ROC curves of the OS nomogram reveal that the AUCs in the training cohort are 0.767, 0.728 and 0.768 for predicting 1-, 3- and 5-year OS, respectively; (B) Time-dependent ROC curves of the CSS nomogram in the training cohort reveal that the AUCs are 0.780, 0.744 and 0.768 for predicting 1-, 3- and 5-year CSS, respectively; (C) Time-dependent ROC curves of the OS nomogram reveal that the AUCs in the validation cohort are 0.757, 0.757 and 0.738 for predicting 1-, 3- and 5-year OS, respectively; (D) Time-dependent ROC curves of the CSS nomogram in the validation cohort reveal that the AUCs are 0.743, 0.754 and 0.729 for predicting 1-, 3- and 5-year CSS, respectively.
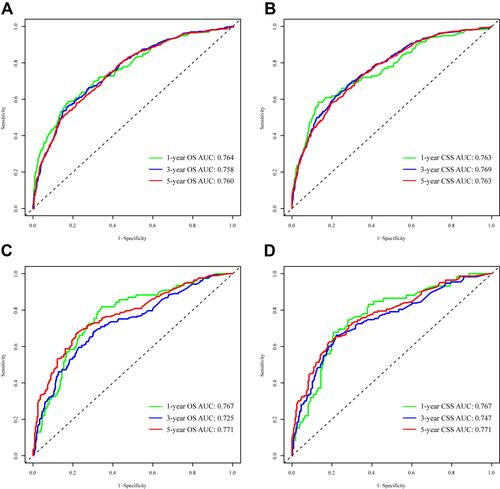
Figure 4 Calibration curves in the training cohort. (A–C) Calibration curves of the nomogram for predicting 1-, 3- and 5-year OS; (D–F) Calibration curves of the nomogram for predicting 1-, 3- and 5-year CSS.
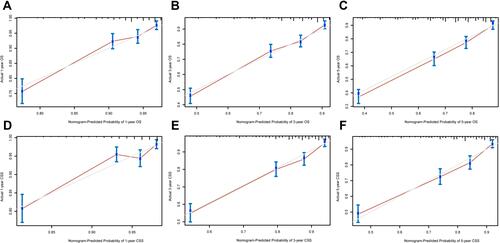
Figure 5 Calibration curves in the validation cohort. (A–C) Calibration curves of the nomogram for predicting 1-, 3- and 5-year OS; (D–F) calibration curves of the nomogram for predicting 1-, 3- and 5-year CSS.
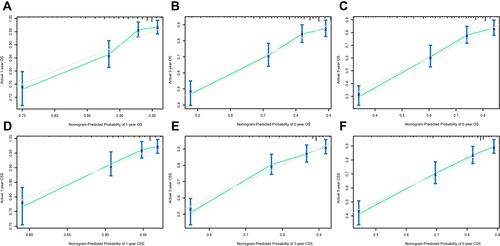
Figure 6 DCA curves of the nomogram, AJCC stage and SEER staging system. (A) DCA curves for OS in the training cohort; (B) DCA curves for CSS in the training cohort; (C) DCA curves for OS in the validation cohort; (D) DCA curves for CSS in the validation cohort.
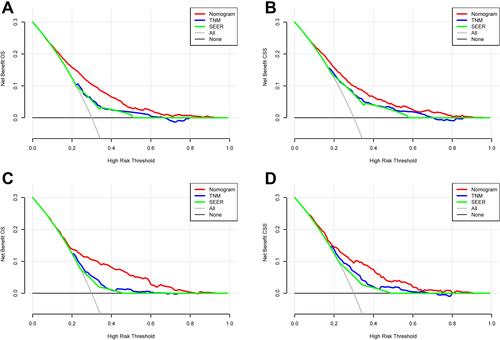
Figure 7 Kaplan–Meier curves survival curves for the high- and low-risk groups. (A) Kaplan–Meier curve for OS in the training cohort; (B) Kaplan–Meier curve for CSS in the training cohort; (C) Kaplan–Meier curve for OS in the validation cohort; (D) Kaplan–Meier curve for CSS in the validation cohort.
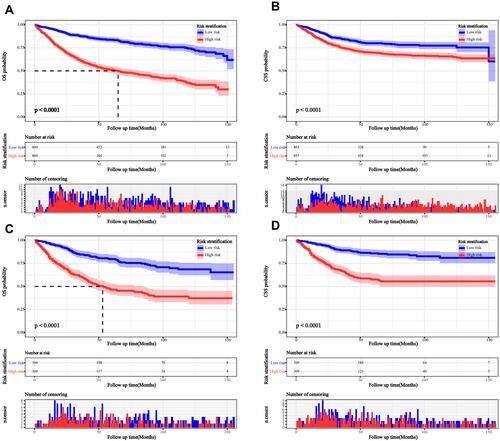
Table 5 Comparison of AJCC Stage and Tumor Size Between Local Resection Group and Radical Resection Group